
Equilibrium prices
Equilibrium prices indicate the true economic value of pollution if all externalities are internalised. But when they are not internalised, how do we estimate the costs?
We can do this in two ways:
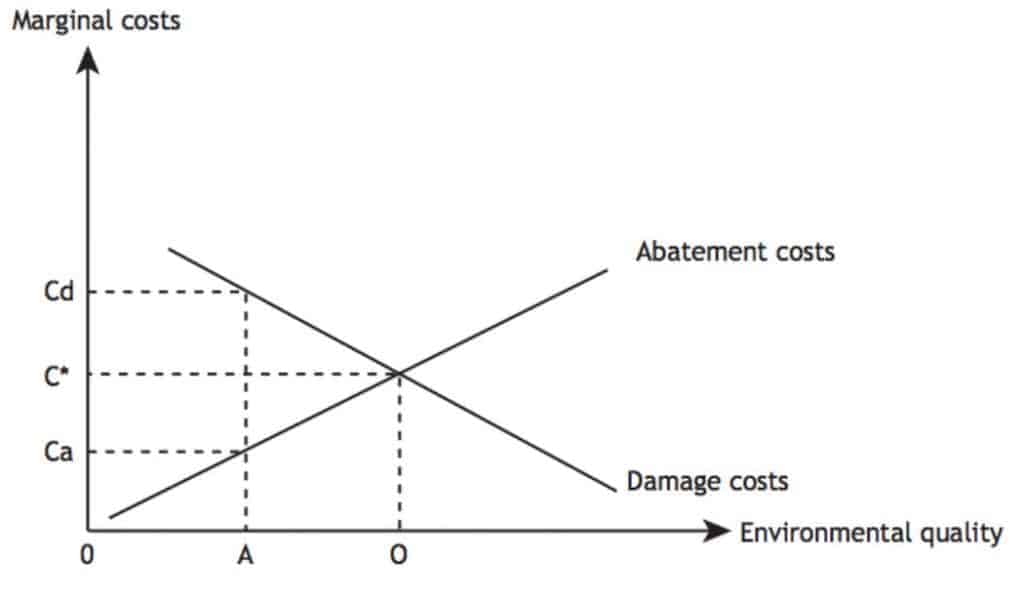
Damage costs
The cost that emission is causing to society. This shadow price is given by Cd and expresses the marginal damage costs.
Abatement costs
The cost of preventing/reducing emissions. A shadow price for the abatement cost function. This shadow price, given by Ca, expresses the marginal abatement costs.
Damage costs
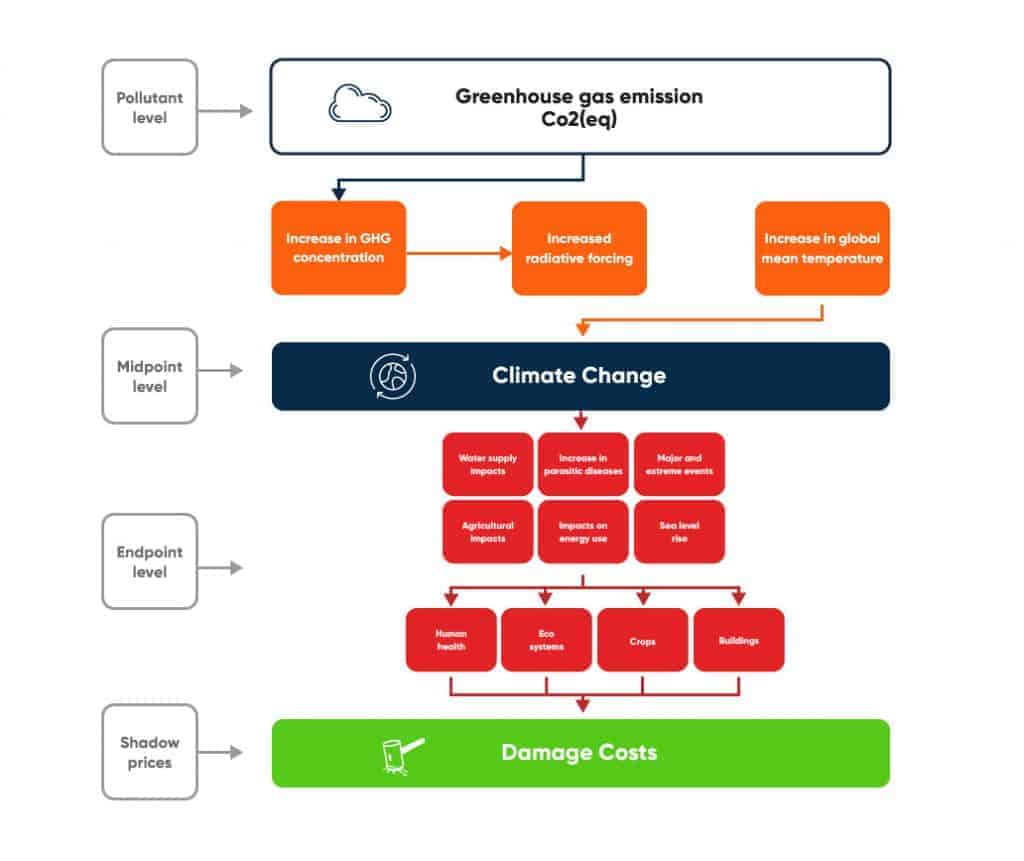
If we want to calculate damage costs, we need to calculate the costs of the consequences of climate change.
Pollutant level: For example, CO2 and CH4 contribute to climate change.
Midpoint: Different pollutants are contributing to climate change, expressed in Global Warming Potential (GWP)
Endpoint: The midpoints eventually have an effect on endpoints such as:
- Damage to human health
- Damage to ecosystems
- Damage to resource availability
- Material damage
Figure 6 shows the impact pathway from pollutant level to endpoint level. There are several consequences of climate change that pose a cost to humanity:
Sea level rise
This may lead to loss of land. Impacts can be measured in terms of costs of protection. Another impact is the cost of human migration.
The impact of climate change on energy use
This will depend on temperature changes that will cause a change in heating and cooling of certain areas.
Agricultural impacts are related to changes in cultivated areas
The yield of certain crops will depend on changes in temperature and precipitation.
Impacts on water supplies
In some areas water shortages will be more severe. Water scarcity globally is likely to increase.
Health effects
Such as increased incidence of certain parasitic diseases like malaria.
Ecosystem and biodiversity impacts
Increased risk of extinction of certain vulnerable species. Also systems like coral reefs are at risk.
Extreme events such as heat waves
Droughts, storms and cyclones could occur more frequent.
Major events
For example, the loss of the Greenland ice sheet, or the collapse of the Amazon Forest.
How high are the social costs of carbon, really?
A meta analysis conducted by Dutch professor Richard Tol from the Vrije Universiteit in Amsterdam estimated the social costs of carbon.
The analysis resulted in an average of 53 $ per ton of CO2 in 2010.
Furthermore, the meta analysis showed that there is a large uncertainty of the exact social cost of carbon.
| SCC per ton CO2 (Tol, 2009) 1995 values | SCC per ton CO2 (Tol, 2013) 2010 values | |
| Average | $41 | $53 |
| Median | $24 | $37 |
| 95th percentile | $146 |
Discount rates and the Stern Review
The effects of climate change will be felt over many hundreds of years, whereas cutting emissions costs money now. How should we weight the value today of costs and benefits in the future? Economists approach this by using a discount rate. All studies are highly sensitive to the discount rate that is used. Essentially, the discount rate is used as a corrective to reflect the opportunity costs of carbon pricing – it compares the value today of costs and benefits in the future. Thus, a high discount rate results in a low cost. A high discount rate would suggest that life today is more important than the life of future generations.
A study, called the Stern Review, was an outlier but is widely discussed for using a low discount rate of only 1,4% (instead of 6%), which led to a social carbon price of 85$ per ton of CO2.
Damage cost can be useful to estimate the cost of the consequences of climate change. It is however difficult to arrive at a consensus because of the following challenges;
- Difference in discounting
- Monetary valuation of human life
- Development countries vs. developed countries
- Inequality distribution of impacts and income
- Incomplete treatment of risk
- Neglect of certain costs or incomplete inclusion
Abatement costs
Because of the high uncertainty in damage cost, policy makers often use the abatement cost of climate change.
The abatement cost method calculates the costs of preventing or mitigating the effects of climate change. The marginal abatement costs, measures the cost of reducing one more ton of CO2e. This cost is highly dependent on climate policies and is therefore strongly subject to policy changes.
Currently the European Union (EU) has set an ambitious GHG reduction goal of 40% for 2030. After 2030 there are no binding agreements yet.
Furthermore, the EU has opted for even more stricter reductions up to 80-95% compared to the 1990 level. Besides, during the Paris agreement summit all parties agreed on a maximum increase of the global temperature of two degrees Celsius (with an aim on 1,5 degrees Celsius). This will mean an emission reduction of around 95%.
Therefore, the abatement costs can be based on the following possible scenarios:
- The EU climate policy up to 2020. This involves concrete price agreements of EU ETS and a 20% decrease in GHG emissions compared to 1990 levels.
- The EU climate policy to reduce up to 40% of the GHG emissions before 2030.
- The Paris Agreement to reduce global warming up to 2 degrees Celsius (with an aim for 1,5 degrees Celsius).
Because we want to aim for the highest amount of reduction, we will base abatement costs on the ‘2 degrees target’. The idea behind this is that a specific region must take prevention measures to reduce CO2e emissions to reach its target.
From an economic perspective, the cheapest measures (in terms of euro/kg) are taken first. This is shown in the Abatement Cost Curve. The abatement methods on the left will have a positive effect on costs, while the abatement methods on the right represent an abatement costs. The width of each bar represents the impact of the measure on CO2e emissions. The abatement methods on the left will have a negative cost meaning that the measure will actually pay for itself while the abatement options on the right represent an actual cost. The width of each bar represents the impact of the measure on CO2e emissions.

Abatement Cost Curve | McKinsey


Carbon Tax and social costs
Since they profoundly drive climate change, greenhouse gases have an effect on society. However, what is that effect on society? We all know that the temperature is rising, but how can we put a price on this?
Externalities: The bigger picture of our economic action
The effects of the emission of greenhouse gases on society is a topic that has been extensively researched in the field of welfare economics.
The effect can be valued and calculated by the use of externalities. To understand this we will briefly go through the concept of externalities.
Subsequently, we will introduce the term shadow prices with the help of abatement costs and damage costs.
Economic markets don’t produce an efficient allocation of goods and resources. One of the reasons for this are externalities. Externalities can be either positive or negative.
Positive externality – Example
A beekeeper who keeps bees for their honey. A side effect or externality associated with such activity is the pollination of surrounding crops by bees. The value generated by pollination may be more important than the value of the harvested honey.
Negative externality – Example
When producing steel the factory uses energy in its processes. This energy use causes the pollution of greenhouse gas. This pollution is a negative externality. Without any regulation, the production decisions of companies will not account for the social and ecological damages of pollution. Furthermore, consumers will also not limit their purchases because of pollution.
The effect of externalities on the market
In the negative example, both parties do not take the externality into account. This will cause the market to produce too much of the product. This is indicated in figure x by the market equilibrium.
When the social costs are incorporated we arrive at the social optimum, showing us that we need to produce less for a higher price. As a result, in order to correct the inefficient market equilibrium, the prices need to be set right. Consequently, we need to know the price we have to add.
This is where the concept of shadow prices comes to play.
Shadow prices
Shadow prices show the actual price of a product or material. Shadow prices are currently used as a tool in a wide range of decision-making processes, particularly by government and industry.
They provide input in two ways:
Shadow prices can serve valuation
In analysing the social effects of an investment decision, shadow prices can be used to take environmental impacts on board alongside financial considerations by assigning them a monetary value. Here, the principal aim is valuation.
Shadow prices can serve weighting
In environmental analysis, shadow prices can be used to assign a relative weight to each of the environmental impacts identified. Here, the goal is environmental weighting, with shadow prices providing a means of comparing environmental impacts based on the same unit of measurement (for example monetary value). A common example of this is the Environmental Cost Indicator, that is often being used for public construction tenders.
Valuing environmental quality
Valuing environmental quality means expressing the value of environmental quality to society in monetary terms.
However, as the value of environmental quality cannot always be obtained directly (via market prices for example), it must be obtained through calculation.
Monetising environmental impacts dates back to the early 1930. Since then, major efforts have been made on both methodological development and practical valuation studies.