Plastic has a reputation issue. For consumers, using less plastic ranks as the number one goal to help the planet. Plastic packaging is frowned upon. Glass, paper, and other „organic“ solutions are gaining popularity.
Material choices define the sustainability of our packaging products. In this case study, we demonstrate how environmentally friendly glass packaging is compared to plastic packaging. For this, we will analyze two common retail products: a jar of strawberry jam and a bottle of apple juice. What will the environmental impact be? And how does it compare to the content of the products?
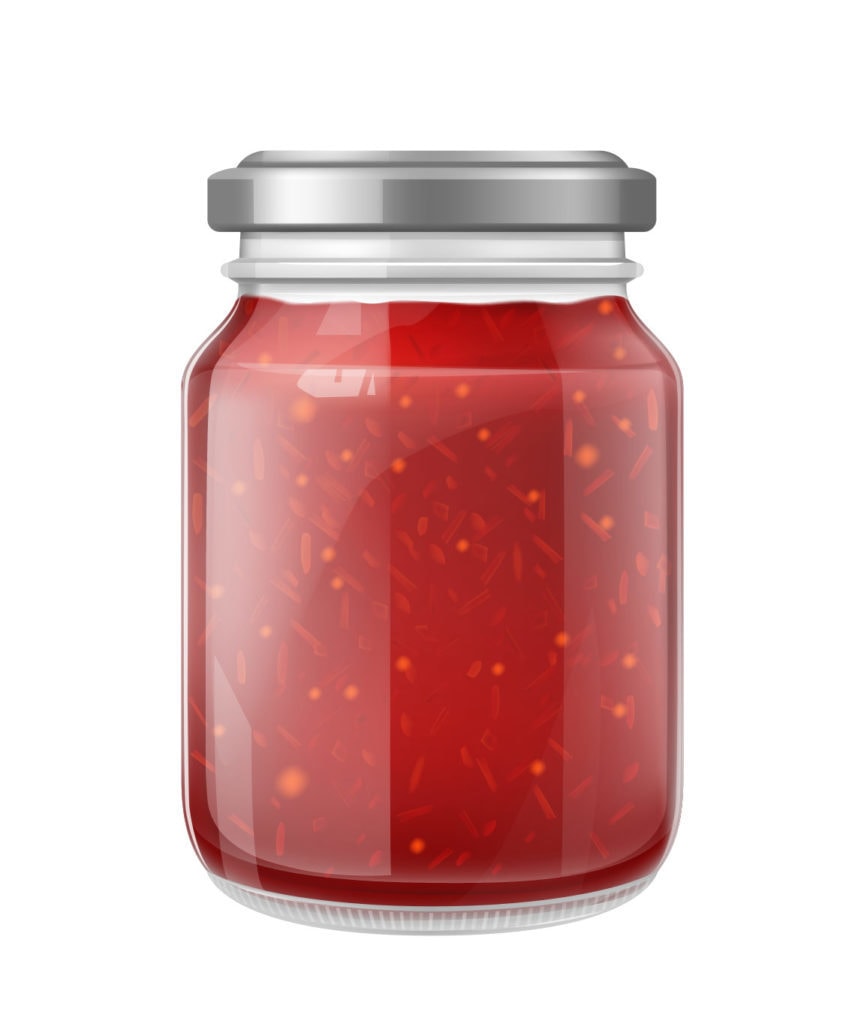
Case 1: The CO₂ Impact Of A Strawberry Jam Jar
In this case, we analyzed the packaging of strawberry jam.
This analysis was based on the CO₂-impact (Global Warming Potential) of the product. So, how does the packaging compare?
We analyzed the following materials:
PET Jar With PP Lid
We analyzed four different PET materials: virgin PET and PET with 30%, 75% and 100% recycled granules.
The molding process for all four PET bottles is the same.
For the waste (end-of-life) scenario, we assumed 50% incineration, 50% recycling; waste management of lid (PP) assumes 100% incineration.
Glass Jar
We assumed that 85% of the glass is being recycled at the end of its life. The molding process of the glass was incorporated into the environmental footprint of the material.
Winner: Plastic bottle
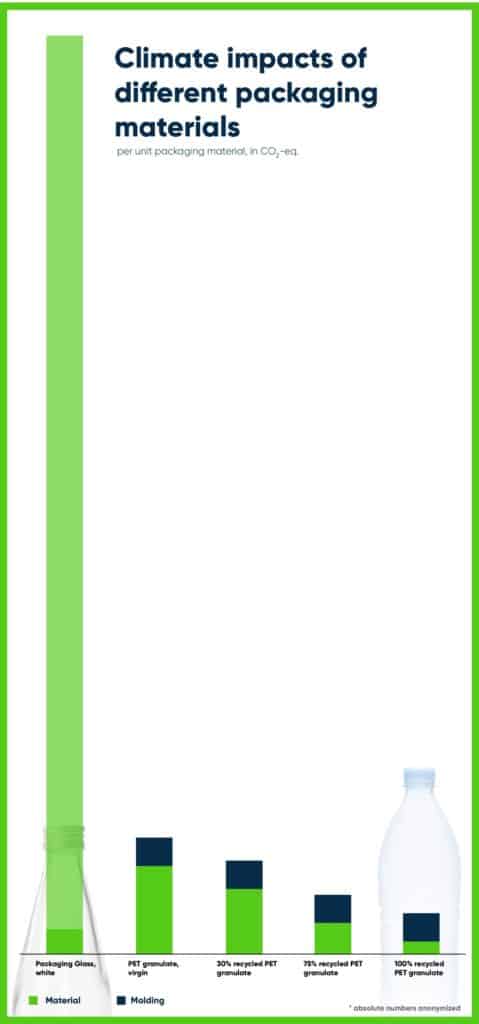
The graphic shows the impact of the raw material (green) vs. the impact of the molding process (blue) in CO₂-impact. It looks like the environmental impact of the glass is lower, correct?
Well, yes and no.
The overall environmental impact per kg is indeed lower for the glass packaging. However, the weight of the glass makes a big difference. Transportation is a big factor of this: from the raw material to the bottle, to the finished product–each step of the supply chain includes significantly higher weights for transportation. In fact, the weight of a glass bottle can be up to 40x the weight of a comparable PET bottle.
When you apply the 40x higher weight for the packaging material, this is what you end up with. Note: in our case, the weight was only 7-8 times as high. Still a significant difference, but not quite as extreme as in the graphic below.
This leads to PET scoring lower overall life cycle impacts compared to glass.
While the depicted comparison is based on CO₂ impacts, the environmental cost indicator (that contains more than just CO₂ impact), shows an even bigger difference. Here, PET is an improvement of up to 80% towards the glass. Again, the significantly higher weight of the glass jar leads to a much higher impact.
The impact of waste management is higher for PET compared to glass, but compensated by lower impacts of the raw material.
So before we jump into the second case, let’s quickly explain how we actually measure environmental impact.
How Do We Measure Environmental Impact?
Environmental impact can be measured in a variety of impact categories. A commonly used one is Global Warming Potential (GWP), which is indicated in kg of CO₂ (As CO₂-equivalent).
However, CO₂ does not take plastic waste or toxicity into account. And of course, plastic waste can not be measured solely in CO₂, as recyclability is one of the main concerns.
For the next analysis, we will, therefore, rely on the Environmental Cost Indicator (ECI), a Dutch environmental indicator, that combines all environmental indicators into one monetary value. This monetary value takes into account CO₂ as well as toxicity and many other environmental effects.
The analysis is based on a Life Cycle Assessment (LCA), the standard calculation method for environmental impacts across the life cycle of a product or service.

Do you measure per bottle or per kilogram?
One of the core issues of measuring the environmental impact of packaging materials lies in the fact that they are rarely a standalone product.
If we take the environmental impact of the product itself into account, the packaging drives a relatively small amount of the total impact.
For this analysis, we only took the packaging into account. However, it is interesting to note that fewer products with plastic packaging fail at the supermarket. We did not take this into account for our calculations, but it is an overall advantage of plastic over glass.
But what about plastic waste?
This analysis incorporates end-of-life scenarios–that means that the recycling or re-using of the materials was also calculated. We’ve received many questions about this–how can it be that glass scores lower than plastic? Simply put, also glass cannot be re-used forever. Glass also gets recycled at some point. This was incorporated into these calculations.
")
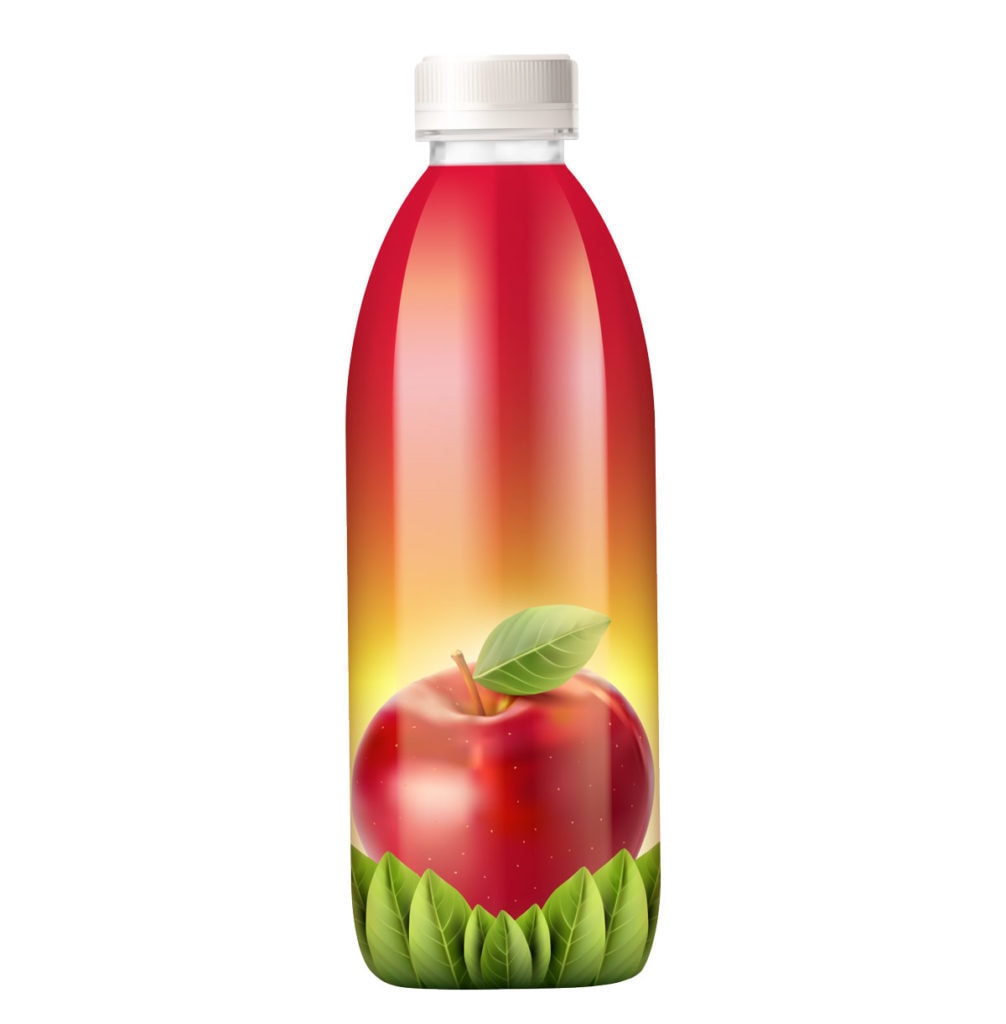
Case 2: Fresh Apple Juice Packaging
In this case, we calculated the difference in impact between plastic and glass packaging for apple juice.
These materials were used for bottling the apple juice:
PET Plastic bottle: 50% incineration, 50% recycling (Current PET processing rate in the Netherlands). Fewer products in PET bottles fall out of the expiration date.
Glass bottle: source separation, allowing for re-processing in the production of glass.
Winner: Plastic Bottle
The analysis shows that the overall environmental impact of PET as a packaging material is lower. This advantage is reinforced because fewer PET bottles fail at the supermarket.
Glass has an advantage in recyclability and the production of the packaging. However, because of the enormous difference in weight, the impact of glass, especially in the transportation phase, is significantly higher.