In LCA we scientifically measure the environmental footprint of a product. And the most essential ingredient (and output) is “data”! Data has different shapes along the LCA-process:
- In LCA phase 2 (image below), the inventory analysis, we map and gather the total emissions (to air, soil, water), resource extractions, and land use/transformations that our product causes. This is called our “life-cycle inventory” (LCI).
- In LCA phase 3 (image below), the Life Cycle Impact Assessment (LCIA), environmental impacts are calculated from the LCI, using “characterization factors”. The result: 15+ environmental Impact Categories.
In this article you’ll learn:
- How to obtain the Life Cycle Inventory (LCI) from product data
- How LCIA “translates” the LCI into environmental impact data
- The roles of different LCIA methods and LCA software in LCIA
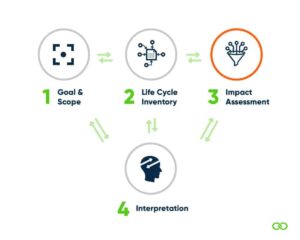
Image 1. The four phases of making a Life Cycle Assessment (LCA).
Phase 2 in LCA: Inventory Analysis – From Product Data to LCI
In phase 2 of making an LCA, we create the foundation we need to make a Life Cycle Assessment of our product! It essentially covers the data collection for your LCA and modeling your product system/creating a flow model of all your input- and output processes.
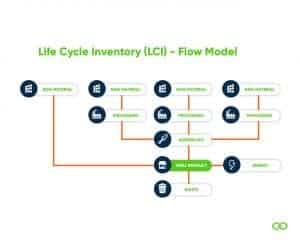
1. “Map out” which materials and processes are part of your product system. Creating a flowchart or flow model (example below) of your product system can help tremendously. Your product system shows all material, energy, transport, and waste flows connected to your product’s life cycle – that you incorporate in your LCA.
2. Collect data on materials, transport, energy use, waste streams, and process emissions that are part of your product system.
3. Find which “environmental interventions” – are caused by all materials and processes in your product system. Environmental interventions are the emissions of substances (e.g. GHG emissions) and extractions of resources caused by your product system.
You find this information through impact references from impact datasets on the emissions (to air, soil, water), resource extractions, and land use/ transformations each part causes. Such datasets can be:
- An EPD from a supplier on a product you purchase (a summarized, verified LCA report)
- An appropriate impact dataset reference from life cycle databases (called secondary data). Every LCA tool has many databases you can use.
- Measuring primary data (when you collect highly accurate raw emissions from your production locations, etc.).
The sum of all environmental interventions from your product system forms your LCI!
Phase 3: Life Cycle Impact Assessment (LCIA)
This phase creates the main LCA results on your product: your product environmental impact data, split into the several unique LCA Impact Categories. It creates the impact data used for making claims, sustainable product design, or reporting.
To understand how LCIA works in detail, let’s have a closer look at its key concepts: (1) Impact Categories,
(2) Characterization factors,
(3) LCIA methods.
1. Impact Categories
To understand LCIA, we first dive into what we’re transforming our input data into!
Impact Categories are the result of an LCA. There are approximately 15+ impact categories in LCA, that give you a clear overview of all the core impacts your product has on the environment.
What are impact categories exactly?
Human activities result in many different chemical compounds that are emitted to – and affect the environment. The effects of chemical compounds with similar environmental impacts are added up. This gives us the total impact on a specific “environmental impact category”. Think of the categories: “climate change”, “terrestrial acidification”, “photochemical ozone formation”, and “human toxicity”.
Each impact category has its “common unit”: e.g. kg CO2-eq for climate change, kg SO2-eq for terrestrial acidification, and kg NOx-eq for ozone formation*. Next to chemical compounds, some impact categories concern resource extraction and land use.
* Examples from ReCiPé 2016.
Summarizing environmental impact categories
Environmental impact categories (“midpoint indicators”) are sometimes grouped into more generic categories (“endpoint indicators”) if they affect these categories. Examples of endpoint indicators are “damage to human health” measured in disability-adjusted life years, or “damage to ecosystem quality”. An important single score/endpoint indicator is the Dutch Environmental Cost Indicator.
2. Characterization factors
Characterization factors “translate” environmental interventions (your emissions and resource extractions!) into results for environmental impact categories. These characterization rules are set by LCIA methods which we discuss in point 3.
How characterization factors work:
We multiply an emission (to air, soil, or water), a resource extraction, or a land use/transformation (from the LCI) with the characterization factors of the environmental impact categories it has an impact on.
Different chemicals can have impacts in the same impact category. These are converted into the categories’ units (such as kg CO2-eq uniting all greenhouse gasses for climate change). But, chemicals can also have impacts in several impact categories.
Impact Category Example: Climate Change
Let’s use the impact category “climate change” as an example:
- Your LCI data shows a total 2.7 kg of CO2 and 0.6 kg of CH4 emitted for our product.
- Characterization factors: 1 kg CO2-eq/ kg CO2 and 28 kg CO2-eq/ kg CH4
- Multiplying LCI data with characterization factors gives us the impact in the category climate change:
- 2.7 kg of CO2 * 1 kg CO2-eq/ kg CO2 = 2.7 kg CO2-eq
- 0.6 kg of CH4 * 28 kg CO2-eq/ kg CH4 = 16.8 kg CO2-eq
- -> Climate impacts: 2.7 + 16.8= 19.5 kg CO2-eq
3. LCIA methods
Different organizations have developed LCIA methods based on different research and geographical contexts. They differ e.g. in their characterization factors and impact categories. Common LCIA methods are the environmental footprint (EF) method, ReCiPé, and CML 2001.
LCA standards (such as the EN15804 +A2 and the PEF) require using a specific LCIA method. Our LCA tool Ecochain Mobius lets you choose among them flexibly.
The important role of LCA software
Handling all environmental interventions by hand. And calculating them into environmental impacts would be a hell of a job, if not (almost) impossible.
Luckily, LCA software tools (such as Mobius and Helix) do this calculation for you. You enter your product data, link it to datasets on environmental interventions, and click on calculate – out comes your environmental impact data in several impact categories.
Now you know what goes on behind the scenes of LCIA – continue reading about how to use Ecochain Mobius to measure a product’s environmental footprint!