What’s the environmental footprint of your product?
If you have ever asked yourself this question, you are not alone.
The demand for sustainable products is constantly rising.
How do you measure a product’s environmental footprint?
A product footprint is measured via the scientific method Life Cycle Assessment (LCA).
An LCA calculates the impact a product (15+ impact outcomes, including a carbon footprint) has on the environment- throughout its entire lifecycle. So, from the production until the product’s wasted.
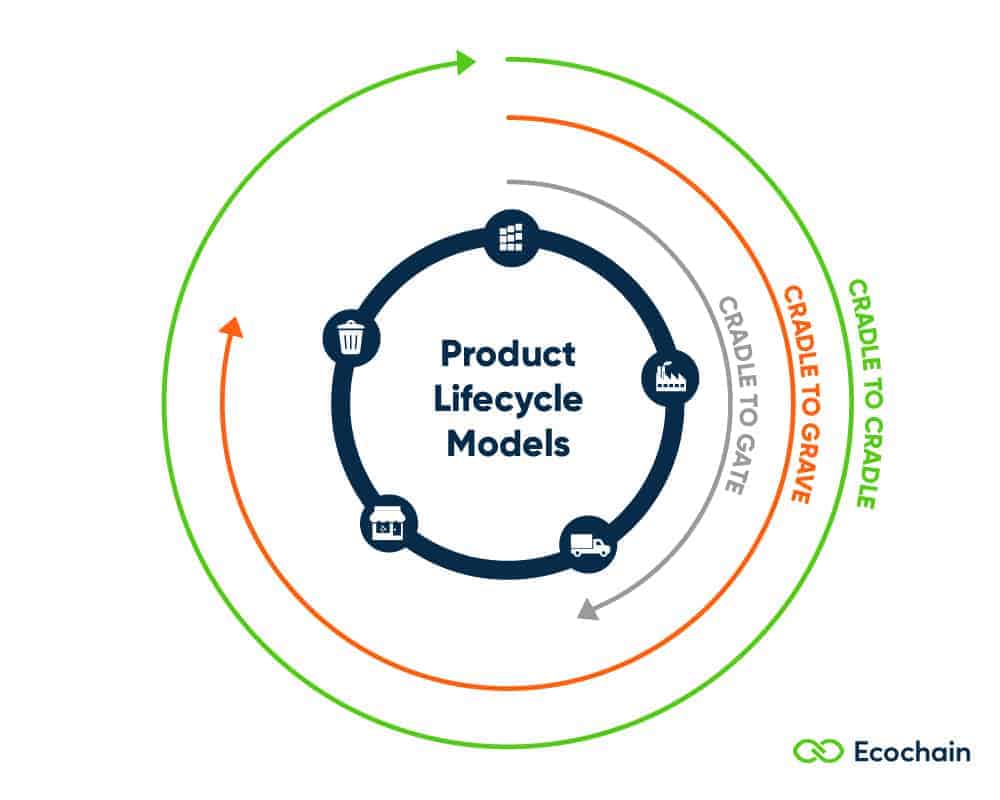
But the lifecycle scope can differ per measurement:
- Gradle-to-grave: When a company measures the full lifecycle of a product. Cradle being the inception of the product with the sourcing of the raw materials, the grave being the disposal of the product.
- Gradle-to-gate: When a company assesses the impact of a product until it leaves the factory gates- before it is transported to the consumer.
- Cradle-to-cradle: When a company measures the full lifecycle of its product(s). But exchanges the waste stage with a recycling process that makes it reusable for another product, essentially “closing the loop” (circular).
Product footprints: The dynamic challenge
But- one of the biggest drawbacks of an LCA analysis is the fact that it is rather static.
Once you have calculated the impact of a product, it is hard to make changes and iterations on it. Which is exactly what you need if you want to make sustainable improvements.
This is where our Product Footprint & Design tool Ecochain comes into play – it allows you to:
- Calculate the environmental footprint of your products,
- Compare your product(s) to alternatives,
- Model sustainable improvements.
In this article, we walk you through the process of modeling the environmental impact of a T-Shirt in Ecochain. And compare it to different alternatives.
Our scope is Gradle-to-gate: the impact of the product until it leaves the gates of the factory.
1. A Black Cotton T-Shirt: The structure
A T-Shirt is a relatively simple product. Yet, there are a number of processes involved in its manufacturing.
We will ignore the packaging of the T-Shirt in this article. But even then, the processes behind the manufacturing of the T-Shirt are:
- Spinning the yarn,
- Turning the yarn into fabric,
- Coloring the fabric,
- Sewing the fabric into a T-Shirt,
- Discarding the waste.
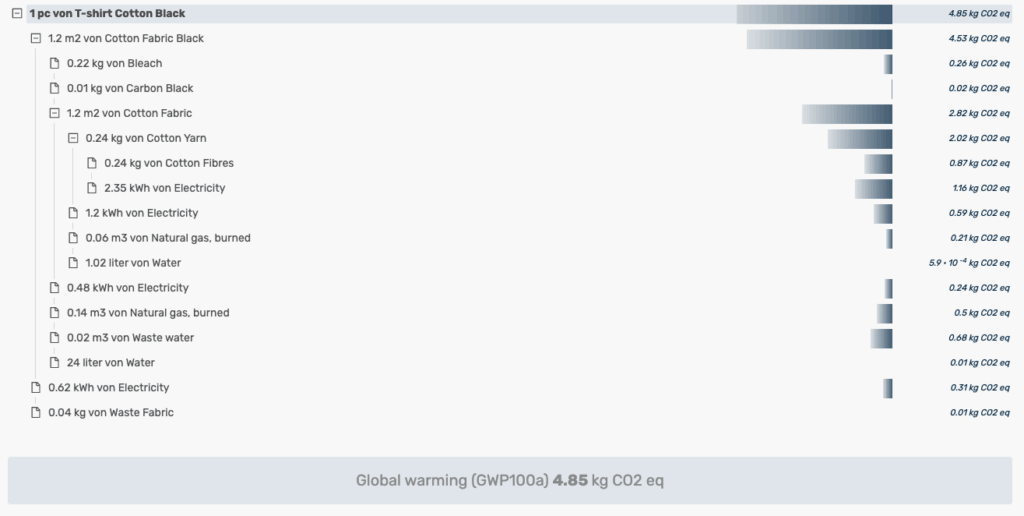
In Ecochain, the structuring of these processes would look like this:

In our example, we already added the number of materials needed for production. This is, of course, different in every company.
2. Assigning database values to the products
Now, what impact does “0,24 kg of Cotton Fibres” actually have?
To answer this question, we connect the cotton fibers to an impact reference in our LCI (Life Cycle Inventory) database: ecoinvent. Ecoinvent provides us with all the latest environmental footprint data for any given material.
After connecting the data, here is the footprint of manufacturing our T-Shirt.
3. Connecting the dots: Unify different values
Electricity and water are used in many different steps along the manufacturing process of our T-Shirt.
But we can only get a real insight into our footprint once we’ve combined the different impacts into useful numbers.
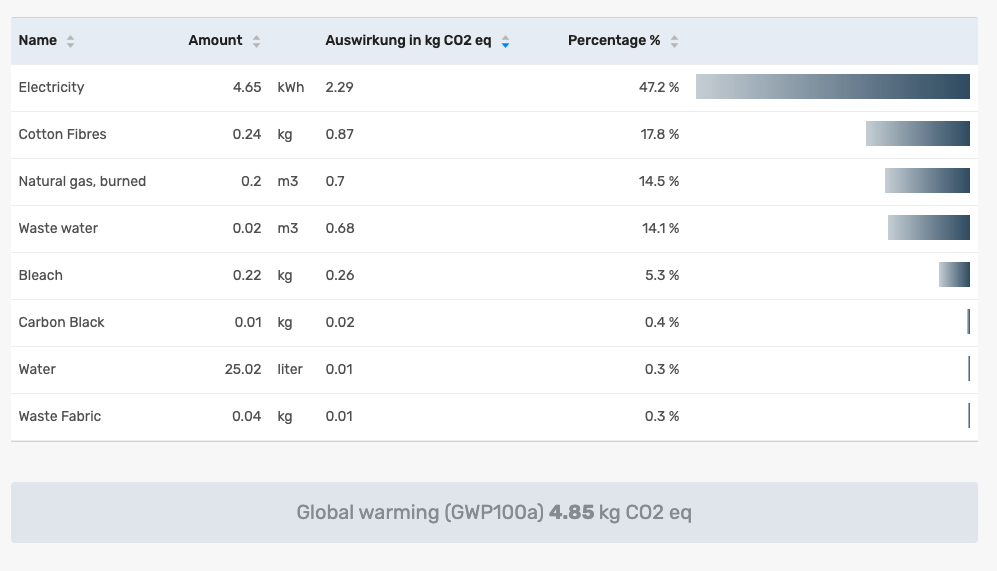
In Ecochain LCA software, the Flat View does exactly that. It provides you with an overview of where your product’s impact really comes from.
In our T-Shirt example, the winner is clear:
- 50% of the carbon footprint comes from electricity used.
- 18% comes from cotton fibers.
This means that optimizing the use of electricity and changing the source of electricity has the biggest potential impact on reducing the CO2 footprint of our T-Shirt. However, looking into alternative fibers (recycled, different materials, etc.) is definitely the next biggest reduction opportunity.
4. Let’s compare – What if I changed the product’s material?
Different materials have different impacts.
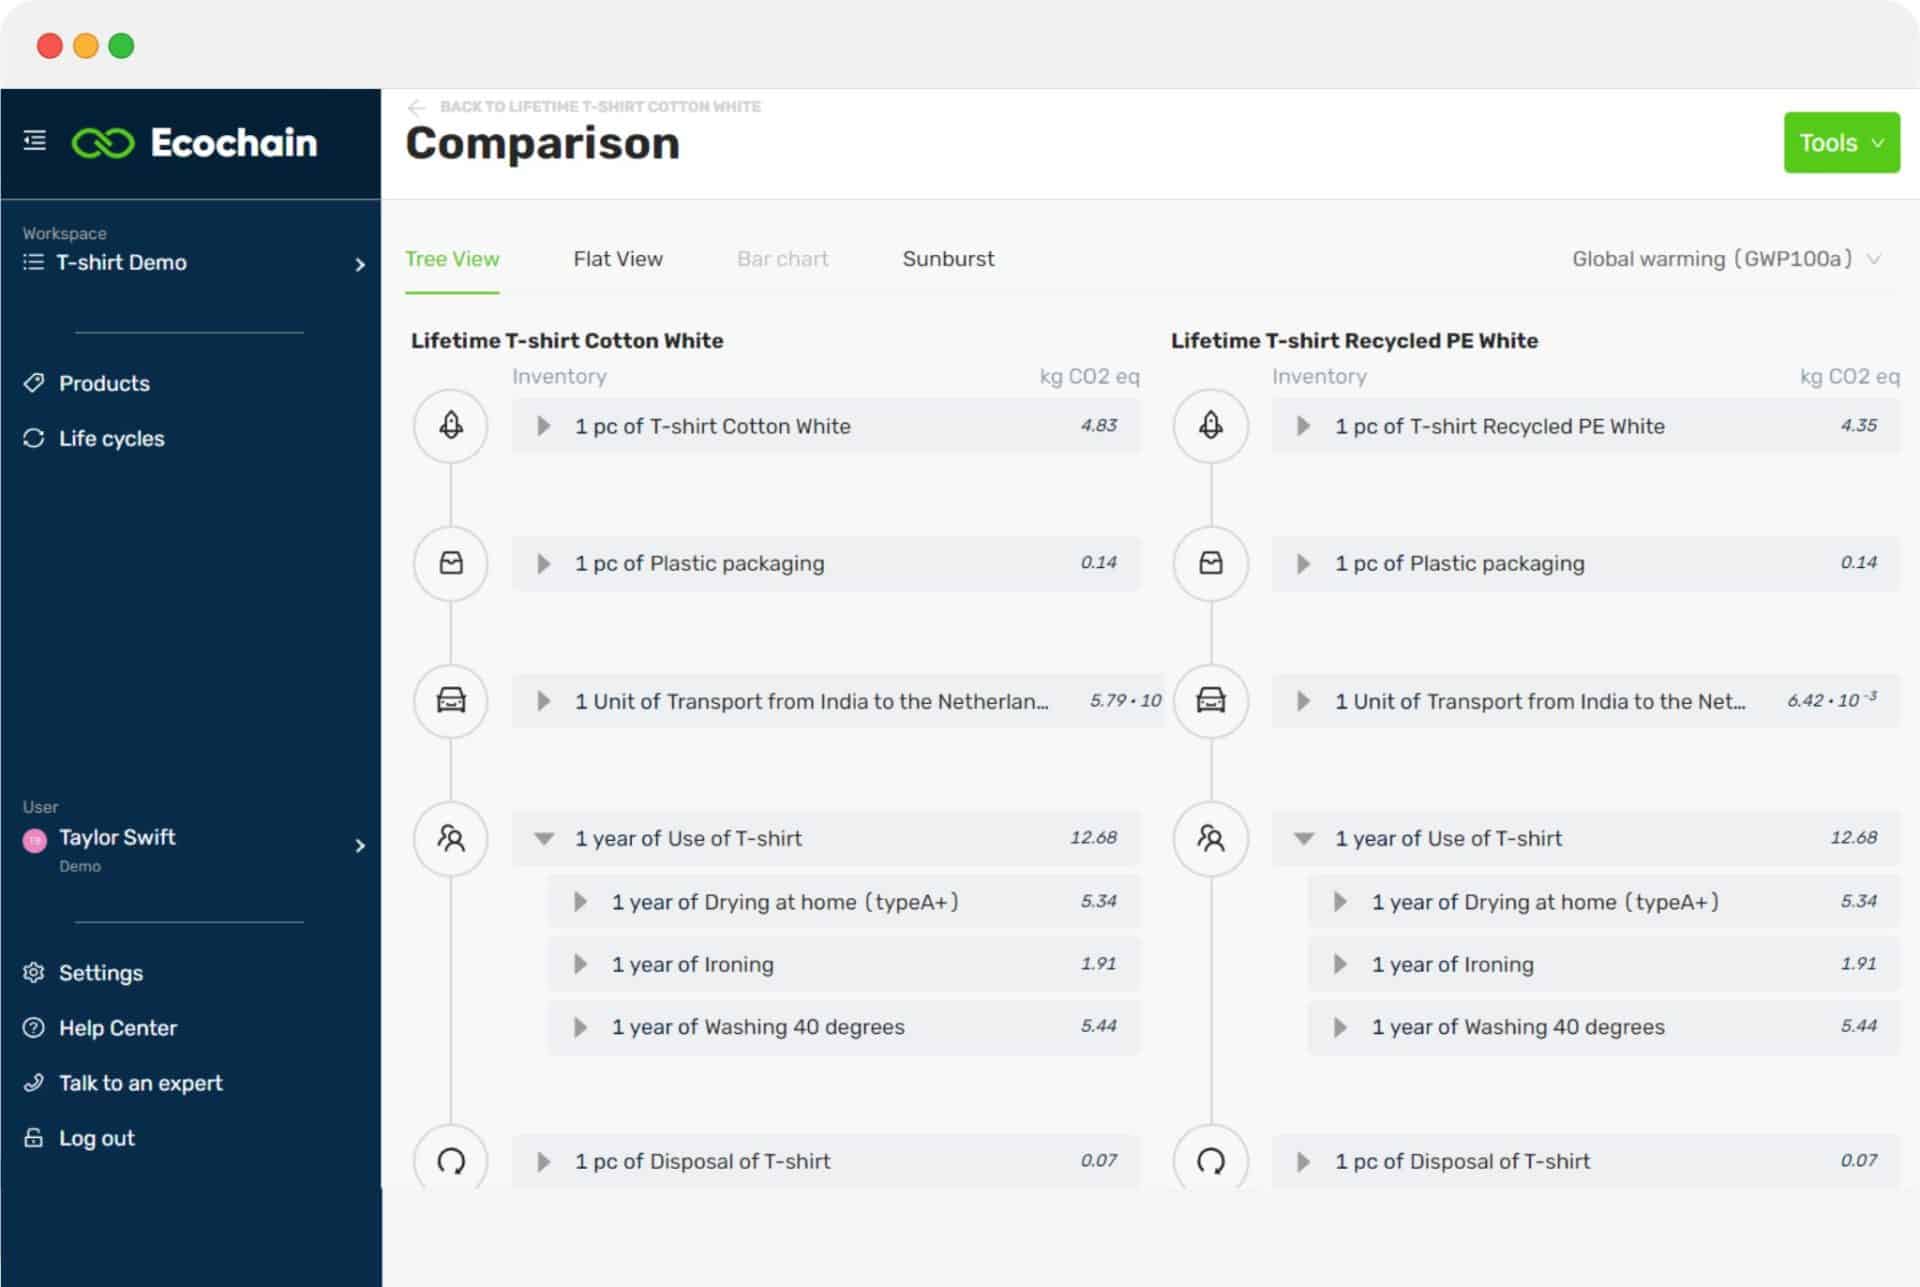
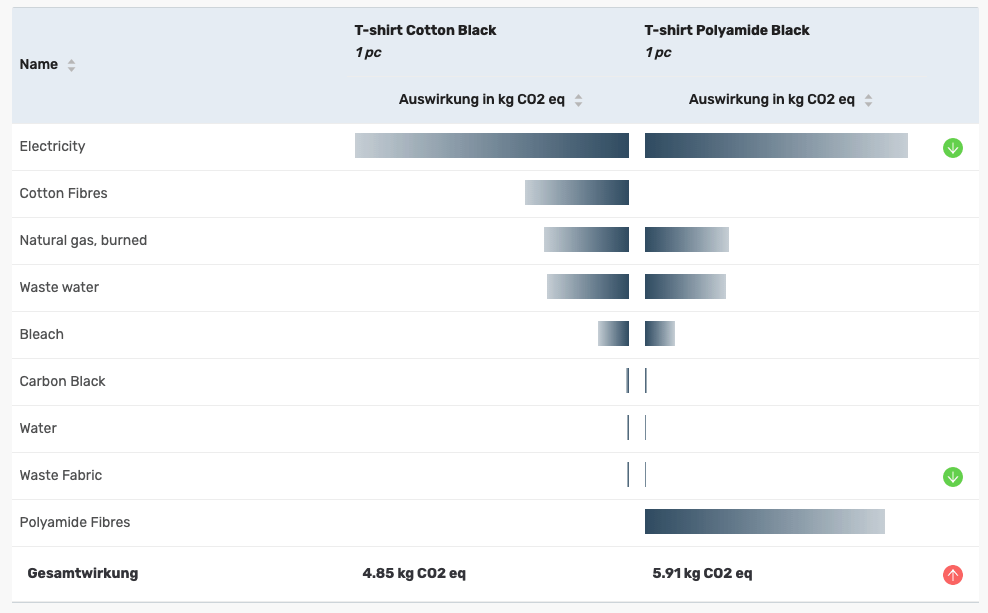
One specifically nice feature in Ecochain is the comparison mode.
Through comparisons, you can compare the impact of the different products side by side.
Exchanging the cotton with Polyamide fibers has a huge impact on our product’s footprint – in fact, the footprint of a polyamide T-Shirt is more than 1 kg CO2-eq higher than the footprint of our cotton T-Shirt!
European PEF regulation makes product footprints more important
Product Footprints are increasingly placed in the spotlight. The European Union is now working on a standard for product environmental footprints (called the PEF).
This will likely lead to more regulations and changing standards in different sectors. This means: now is a good time to get familiar with the environmental footprint of your products.
Note that the PEF guidelines are still in development. So, we can’t say for certain what they will include yet. But from 2024 onwards, the PEF will have a significant mandatory impact on many companies throughout Europe.