The third Phase of LCA gave you your LCA results. Great! You know the environmental footprint of your product! Now…what does it tell you exactly?
The fourth (and last) Phase of LCA is about interpreting these results and gaining the environmental insights you need. So, let’s get into:
- The goal and process of LCA Interpretation
- Sensitivity analysis, to check and improve LCA result-reliability
- General analysis, to gain insights
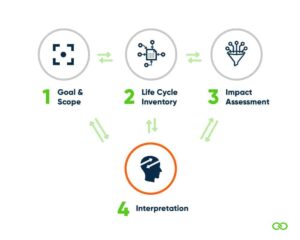
Image 1: Interpretation is the last Phase of LCA, but it links back to all other Phases.
How Interpretation of LCA results works
Interpretation (LCA-Phase 4) links back to all other LCA Phases. You analyze the Impact assessment results (from Phase 3) based on your LCA’s Goal and scope (which we defined in Phase 1). We’ll get into the methods on how to do these analyses below.
Analyzing your results is crucial, as it may point you to mistakes, missing data, or the need for better quality input data (LCA Phase 2). After potentially improving these aspects in the inventory (Phase 2), you need to run LCA calculations again.
This is why LCA is called an “iterative process”. With each iteration, your LCA gets better! All the while you gain reliable & relevant insights. Finally, you draw conclusions – and use those for improvement and/or environmental reporting.
Always do a Sensitivity Analysis
You’ve put lots of data into your LCA – primary, secondary, and some assumptions (for example, if you didn’t know the transport distance of a certain material, you made an assumption on how much it is). But which data are crucial to get right – and where are you allowed to make an approximation?
That’s what a sensitivity analysis tells you! And this is how you perform one.
1. What to do sensitivity analysis on
Your LCA standard (e.g. the EN15804+A2, Bepalingsmethode, or ISO1404/14044) may prescribe what to do sensitivity analysis on. Otherwise do sensitivity analyses on uncertain or low-quality data.
Uncertain data is:
- Data from weak sources (not credible or badly researched)
- Data range: When a numerical data point lies within a range. For example: “This device probably uses that much energy, but some literature cites other values”. Or if you make your transport distance bigger, does it change your LCA results by more than 5%? If it does, it’s crucial to try to get the exact data. If not, an approximation is fine. Here, aim to test out the best- and worst-case.
- Assumptions: Just like with data ranges (but more qualitative), several choices are possible. Can you check if the assumptions you made have a big effect on your LCA results, once you change your assumption? For example, I assume that X% is incinerated and Y% is recycled. Then change the % of X and Y in a sensitivity analysis.
- Alternative options: This heavily ties in with checking assumptions. When other production routes, materials, secondary datasets, or allocation methods could be used for modeling your product. Check the potential differences in your LCA results outcomes. (Make sure this is still about your product – sensitivity analysis is NOT about hypothetical alternative scenarios).
2. How to do sensitivity analysis in LCA
You can relatively easily do a sensitivity analysis in an LCA software tool for all your uncertain parameters (assumptions or data doubts).
For example, in Ecochain Mobius:
- Change an input parameter (such as transport distances or material use) in your LCA result overview, recalculate, and note down the percentage changes (%) to your initial results (your baseline) per impact category.
- Or make a copy of your product and change input parameters in your copy. Now you have your different results next to each other, and can easily see/or not see any difference.
3. Improve sensitive data
“Sensitive parameters” are those that, when changed, have significant impacts on results. For example, the Dutch construction LCA method de Bepalingsmethode states that when the sensitivity is more than 20%, a product has to be redefined. Sensitive parameters are crucial to get right for accurate LCA results! So, ideally, we go back to Phase 2 (Inventory analysis) and improve our data quality. (This gives you new baseline LCA results, on which you need to redo a sensitivity analysis.)
If you can’t improve data quality, be transparent about how the uncertain parameter affects your conclusions. This can set the tone for further investigations and makes your report more trustworthy!
Analyzing LCA results: What Are Your Impact Hotspots?
After your sensitivity analysis and potential data improvement, your LCA results are more reliable. But still “just numbers”. What do they tell you? How can you use these insights?
To find out, look back at your LCA’s Goal and intended audience (defined in Phase 1). What is relevant to your audience, and which insights do you need?
Accordingly, pick analyses suitable to these questions. The most common analysis:
Contribution analysis
In contribution analysis, you asses which “things”, aka processes, materials, life cycle stages, or emissions drive your biggest impact. These big impact chunks are also called Impact Hotspots. Assess:
- Which product life cycle stages (or which Modules in the EN15804+A2) have the highest contribution to a specific impact?
- Which environmental impact categories are the biggest?
- For the biggest impact categories: which elements (materials or processes) of your product system have the highest contribution to a specific impact? (Especially relevant for product designers, because this is where you can effectively improve!)
For “things” that have surprisingly high or low impacts, double-check your input data for mistakes and data uncertainty (see sensitivity analysis).
Drawing conclusions
You used sensitivity analysis to make your model as accurate and reliable as possible. Then you analyzed your LCA results according to your Goal and audience. Now, get inspired on what kinds of improvements you can make.
Conclusions and recommendations likely come to mind easily by now:
- What impact does this information have on potential stakeholders?
- What are we doing well already?
- Where can you improve? Which materials or processes can be changed for the better? Who do you need for that?
- Etc. etc.
After all, sustainability is an ongoing process of gaining insights & making improvements. Most importantly: it’s fun!
Learn how to credibly and transparently communicate your LCA results in our article here.