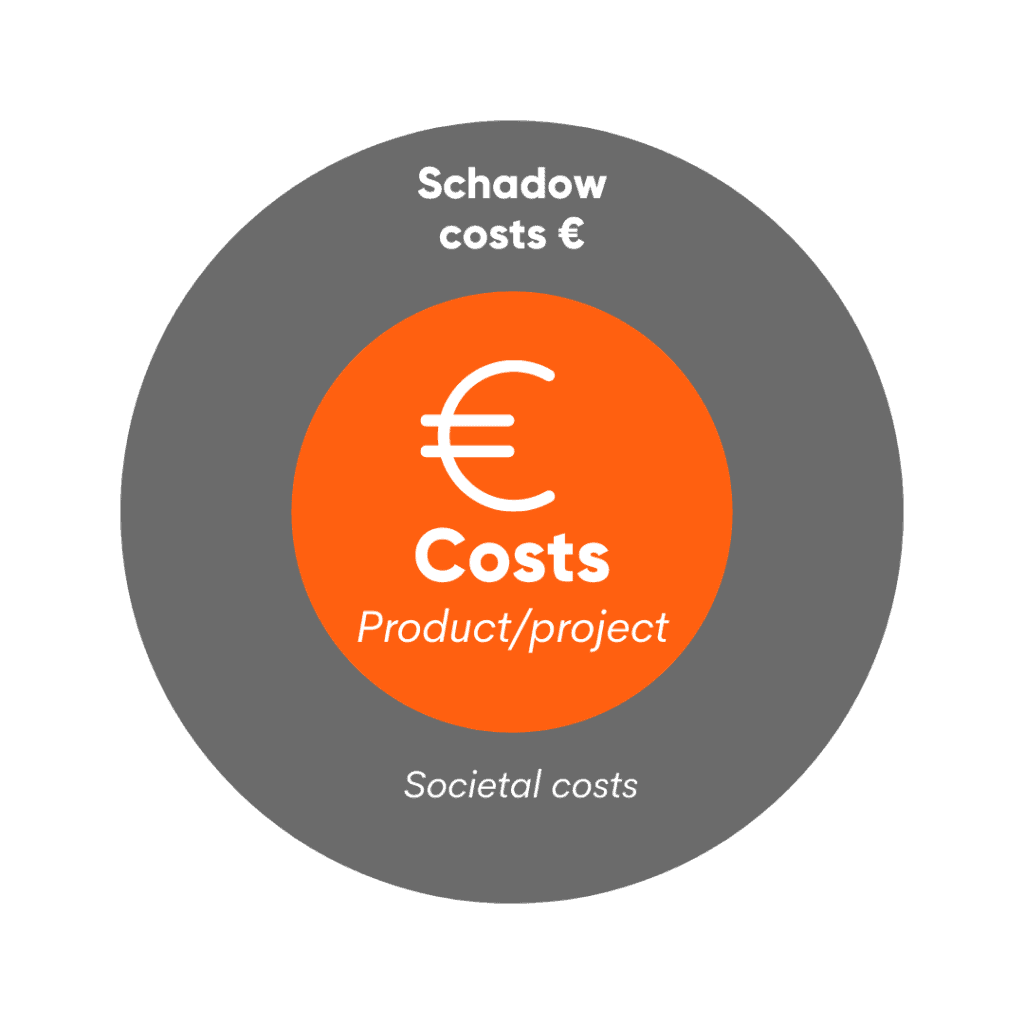
The Environmental Cost Indicator (short ECI) is a single-score indicator expressed in Euro. It unites all relevant environmental impacts into a single score of environmental costs, representing the environmental shadow price of a product or project.
Generally, most of the emissions of a product are not created at a production facility, but along the supply chain. This can be measured by conducting a Life Cycle Assessment (LCA).
Because the environmental data comes from many different sources, the environmental impacts that are measured vary a lot: They all are measured in different impact categories.
For that reason, these numbers can become hard to compare. This is where the Environmental Cost Indicator comes into play: As a single-score indicator, it simplifies and unites different environmental data points into one (monetary) number.
As a result, we are left with one indicator that can be compared across industries.
In this article, you will learn what the Environmental Cost Indicator (ECI) is, what it is used for and how it can be calculated.
Important to note: Due to the revised European EPD norm the EN15804+A2, the ECI will change. You can read more about the EN15804+A2 here.
Public Procurement with the Environmental Cost Indicator (ECI)
In The Netherlands, circularity and green public procurement are becoming increasingly important. Thus, the results of Life Cycle Assessments (LCA) are gradually being adopted for this purpose.
Recently, results from LCAs are used increasingly in public procurement tenders, especially in the Dutch construction sector. In these tenders, the Environmental Cost Indicator (ECI) is used as an important criterion to determine the winning bid.
In The Netherlands, the Environmental Cost Indicator (ECI) is known as Milieu Kosten Indicator (MKI)
How ECI is being used in tenders
Above all, the ECI value ensures that the environmental performance of different contractors can be compared objectively.
“ECI value ensures that the environmental performance of different contractors can be compared objectively.”
Discounts through lower environmental costs
By providing an Environmental Cost Indicator for their project, the contractors can receive a fictional discount on their offer. As a result, the offer with the lowest environmental costs receives the highest discount.

This means that, even if the actual price of the offer is higher, a better environmental performance increases the chance to win the tender.
Maximum ECI for contract requirements
In other cases, ECI values also serve as thresholds, where maximum ECI values are incorporated into contract requirements. Due to that, offers with a low environmental performance get automatically rejected.
Environmental Cost Indicator (ECI) – Calculation in 4 Steps
To calculate our ECI, we need to follow the steps from a Life Cycle Assessment. This is a quick overview of those steps.

1. Input data
First, we need to collect the data on raw materials, semifinished products, processes, and energy used in the product or process we are trying to analyze.
2. Calculation of Emissions
Now, we evaluate the emissions these inputs cause – for example, CO₂, PO₄³⁻, and NOx.
3. Characterisation into Impact Categories
In this step, we characterize our emission data into impact categories.
Quick Overview: Impact Categories
You can get a more detailed overview on impact categories in our main article: Impact Categories (LCA)
The emissions generated during the life cycle of products and projects are converted into impact categories, such as climate change (GWP) or toxicities. These conversions are based on complex scientific models, which take into account the emissions to air, water, and soil, and a number of substance properties such as biodegradability, volatility, solubility, toxic mechanisms, and so on.
4. Weighting of Impact Categories
However, with a list of impact scores for a number of categories, comparisons between products may still be difficult or inconclusive. In order to create a single, comparable number like the ECI, the scores need to be weighted and merged.
The environmental impacts are weighted based on the shadow price method. The shadow price is the highest cost level acceptable for governments per unit of emission control (prevention costs).
Environmental Cost Indicator: Example
The weighting of environmental impacts is done by using calculation factors like the ones below.
| Impact category | Unit | Weighting Factor (€/ unit) |
| Global warming | kg CO₂-eq | 0,05 € |
| Ozone depletion | kg CFC-11-eq | 30,00 € |
| Acidification of soil and water | kg SO₂-eq | 4,00 € |
| Eutrophication | kg PO₄³⁻-eq | 9,00 € |
| Depletion of abiotic resources – elements | kg Sb-eq | 0,16 € |
| Depletion of abiotic resources – fossil fuels | kg Sb-eq | 0,16 € |
| Human toxicity | kg 1,4 DB-eq | 0,09 € |
| Freshwater ecotoxicity | kg 1,4 DB-eq | 0,03 € |
| Marine water ecotoxicity | kg 1,4 DB-eq | 0,0001 € |
| Terrestrial ecotoxicity | 1,4 DB- eq |
0,06 € |
| Photochemical oxidant creation (Smog) | kg C2H4 | 2,00 € |
In a product, this is what the Environmental Cost Indicator can look like.
In the left diagram, we can see the impact of a beer keg on global warming, measured in CO₂-equivalent. In the right diagram, the same data is translated into the environmental cost indicator in euro. We see that the green slice in the right diagram is significantly bigger than in the first diagram – this could lead to the conclusion that effects other than CO₂ have a relatively high contribution to the environmental cost of the product.

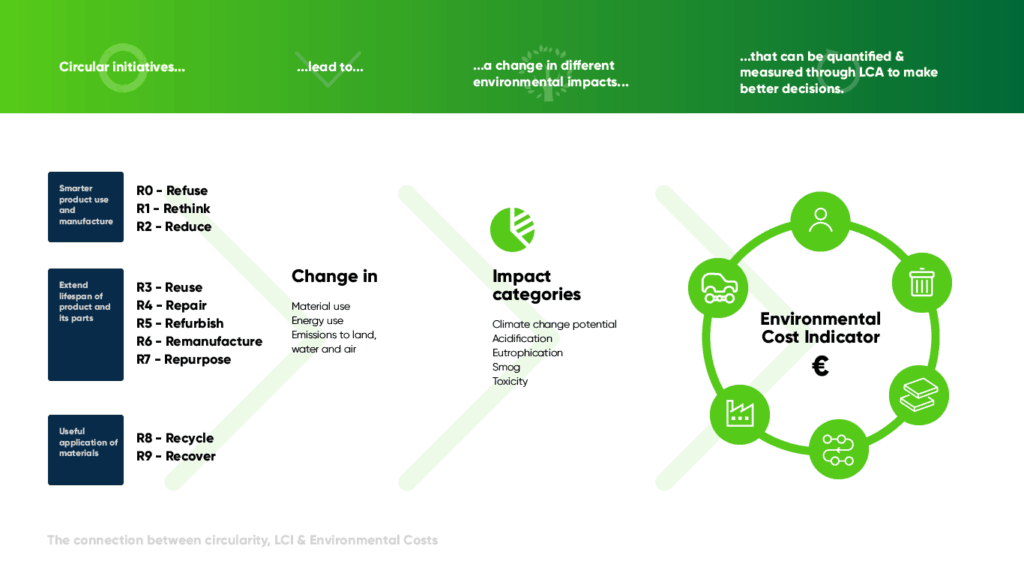
Environmental Cost Indicator: How it is connected to the Circular Economy
The Environmental Cost Indicator can also serve to measure initiatives towards more circularity. This is shown in the below graphic (click to expand): Circular initiatives reduce material, energy use, and emissions, which can be measured in different impact categories, which then get consolidated into the Environmental Cost Indicator.