There are two ways to get fit: Dieting and working out. But it’s impossible to say what should have the biggest priority for you – it depends on how fit you already are, what you eat and drink, and how much you already exercise.
The same principle holds true for environmental emissions. Every industry has different challenges, and one way to identify these challenges is by taking a look at Scope 1, 2, and 3 emissions.
Here is a very short explanation (you can find the in-depth explanation in our detailed article): Scope 1 emissions are direct emissions that you control and own. Scope 2 emissions account for purchased energy and heating/cooling. And Scope 3 emissions come from sources that you do not directly own or control.
Even shorter: While you can directly influence Scope 1 and 2, Scope 3 is accounted for by your value chain – mainly your suppliers.
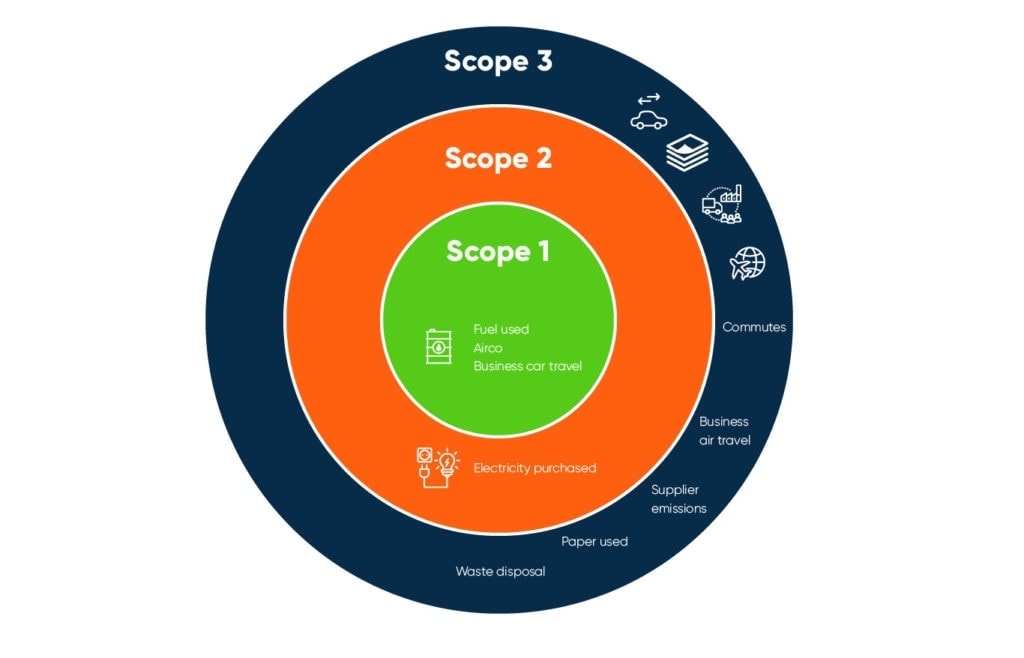
That means that Scope 1,2 and 3 emissions tell us where we need to optimize our efforts for a better environmental performance. Do they mainly come from Scope 1 or 2 emissions? Then we need to optimize our own manufacturing processes. Heavy on Scope 3? Then we need to take a closer look at our supply chain and our sourcing decisions.
What the data tells us about different industries
We’ve analyzed our data and taken a closer look at our clients from different industries.
Where does the impact really come from? In this slide show, you’ll find information on building materials, chemicals, electronics, food, meat & dairy, furniture, healthcare, metals, retail, rubber, technology, and textile.


Where the data comes from, what it says – and what it doesn’t say
The data in the graphics is based on sample data from clients within our application per industry. It is an interesting comparison of impact throughout industries – but at the same time, the comparison is also limited.
Your portfolio of Scope 1, 2, and 3 emissions is defined by your role in the supply chain: While an agricultural farmer will have most of his impact categorized as Scope 1, a brand that procures most of its goods will naturally have mostly Scope 3 impacts. So take these numbers with a grain of salt – only measuring your impact will show how your company performs. Many of our clients are brands and companies that operate later in the value chain – thus the heavy lean towards Scope 3 emissions.