Life cycle assessment (LCA) is a tool used to measure the environmental impact of a product from the start to the end of its lifespan.
Since more than 81% of consumers feel that companies should be doing their bit for the environment, LCAs provide valuable insights that prove just how sustainable a product really is.
Although this may sound like a great thing to have as a business, the information tends to be presented as a complex report which is difficult for everyday customers to read through and understand. This makes it tricky for businesses to incorporate as part of their sustainability claims.
In this article, we discuss some of the key ways that web design elements and infographics can be used to present an LCA without losing the attention of website visitors.
To provide a strong example of how a business has used its LCA as part of its brand, we will use Dopper as a case study. Dopper partnered with Ecochain to create a digital product passport using data from its LCA, informing customers of the environmental impact of their bottle.
(Image source: Dopper)
Using Web Design and Infographics to Present an LCA
For businesses prioritising sustainable product design, web design offers the opportunity to make an LCA engaging. By utilising website features that can make complex information digestible and easy to understand, users are much more likely to gain an understanding of what the data is showing.
Here are some ideas for businesses that are looking to put their LCA to use:
Add overlapping layers
To tackle the issue of different users wanting different levels of information, implementing overlapping layers into a web page can provide a solution for all viewers.
By creating elements that contain key pieces of information, whether that be a statistic or a notable insight, and providing further information when it is clicked on, readers looking for more details can easily access it.
Using layers in web design not only appeals to different audience types, but also maintains a much cleaner interface. Hiding large chunks of text behind the initial face of the page avoids creating a cluttered space that can put viewers off reading any further.
Businesses can use a website builder to create a more interactive website that lays out information in a more digestible way – without sacrificing the amount of information that is available.
Create interactive infographics
Interactive infographics are one of the most effective ways to present an LCA in a user-friendly way. By adding visuals and interactive features that can engage viewers, the content is much more likely to be absorbed and understood.
An example of an interactive infographic would be a lifecycle diagram that contains interactive icons. Each phase, whether that be raw materials, production, or transit, can provide further information and data if users either click or hover over certain areas of the infographic.
This approach allows users to access the level of information that they want. For those who want more technical breakdowns, they can easily find these, whereas those who just want a quick overview can see the top-level insights.
As well as catering to different audiences, interactive elements are shown to get over 52% more engagement than static content. Taking web design to the next level will provide a more enjoyable browsing experience that increases the likelihood of users sticking around.
If we go back to the Dopper case study, the image below shows one of the infographics they have created to bring together key pieces of information. By compiling some of the most impactful statistics, even casual shoppers can notice the impact that the business has had.
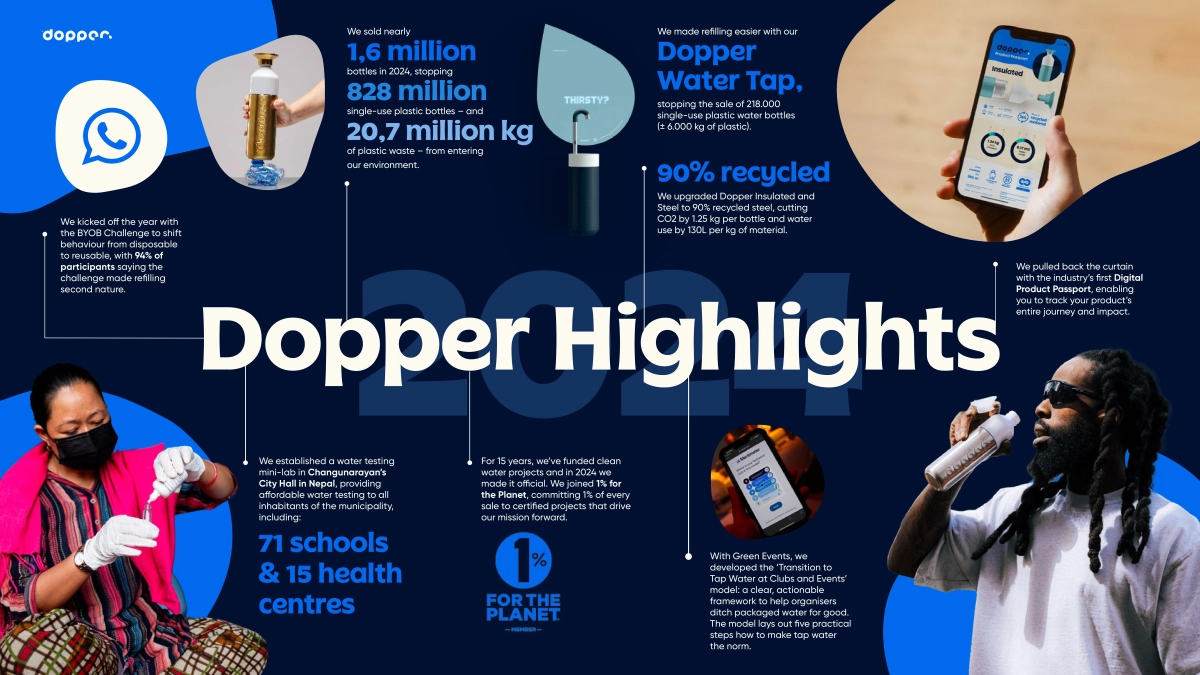
(Image source: Dopper)
Design scrollable modules
To break down an LCA into more manageable chunks, designing the web page to use scrollable modules will help users digest the data.
Instead of overwhelming users with all of the information at once, presenting a section at a time will naturally tell the story. This means that as the user scrolls down the page, more information will pop up to display separate modules that each focus on a different area of the cycle.
By separating information into different chunks, people can easily scroll to find what they are looking for without having to scan through endless blocks of text. This is especially useful for mobile users since they can quickly locate the section they want, even on a small screen.
To enhance web design efforts even further, animations and visuals can be added to the different modules to improve engagement and provide an enjoyable visual experience. By breaking up the complex information into easily digestible blocks, users are much more likely to understand what they are seeing.
Don’t hide the LCA away
Many businesses fall into the trap of hiding LCA information in a standalone section of the website which is not on the main navigation bar. Whether that be a sustainability page tucked away in the footer or an LCA page that is only accessible through internal links, this means the important data is not easily accessible for those who are looking for it.
A business should use its LCA to its advantage since it can build trust and show a brand’s commitment to sustainability. This doesn’t have to mean providing lengthy reports – key insights can be integrated into the web design to support different stages of the customer journey.
Some effective ways to integrate an LCA into other areas of a website include embedding metrics onto product pages, adding visuals that show low carbon or water footprints, and adding proof of any sustainability claims.
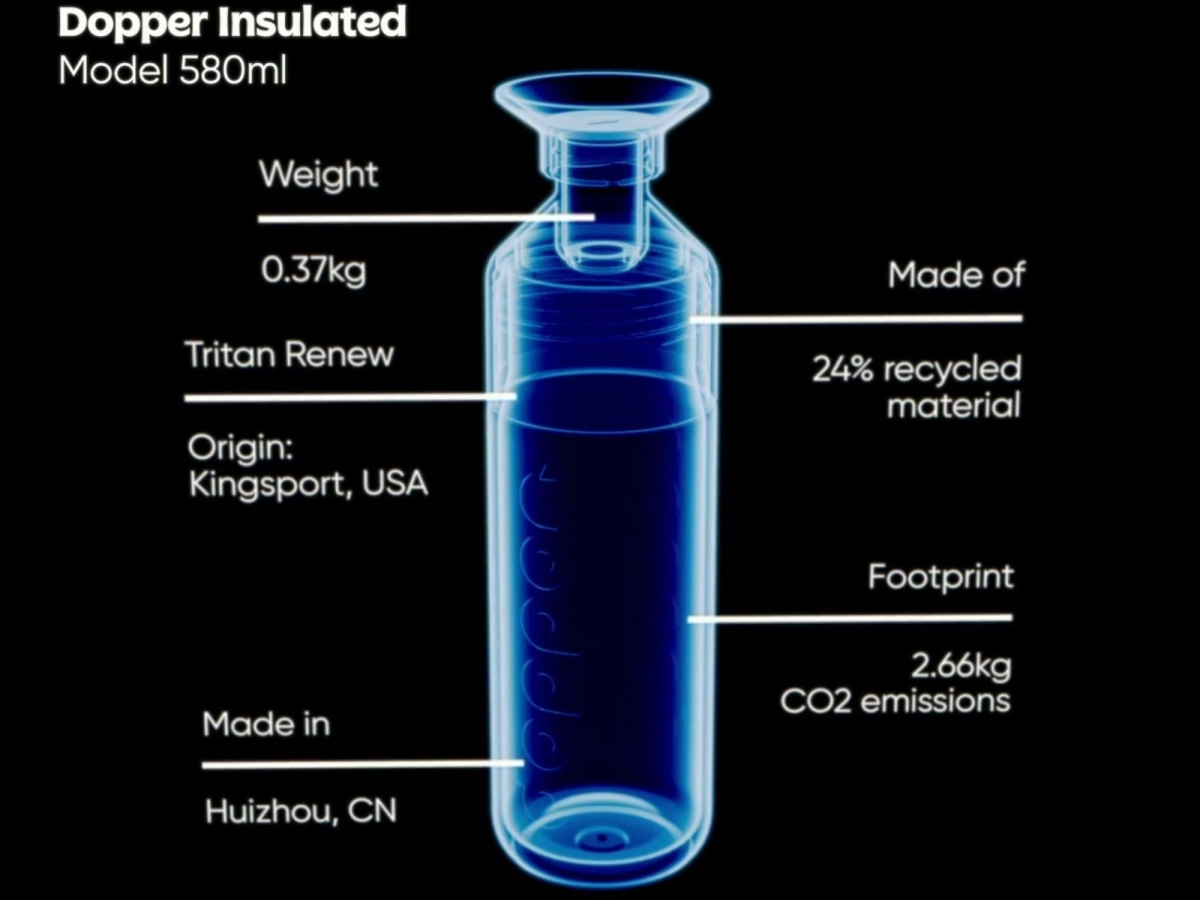
Dopper has chosen to make their LCA accessible via a dedicated digital product passport page. The information is accessed via a QR code so customers can access information about the product’s low environmental impact. Adding a digital element to a physical product means they are able to share more information than would otherwise fit on the label.
(Image source: Ecochain)
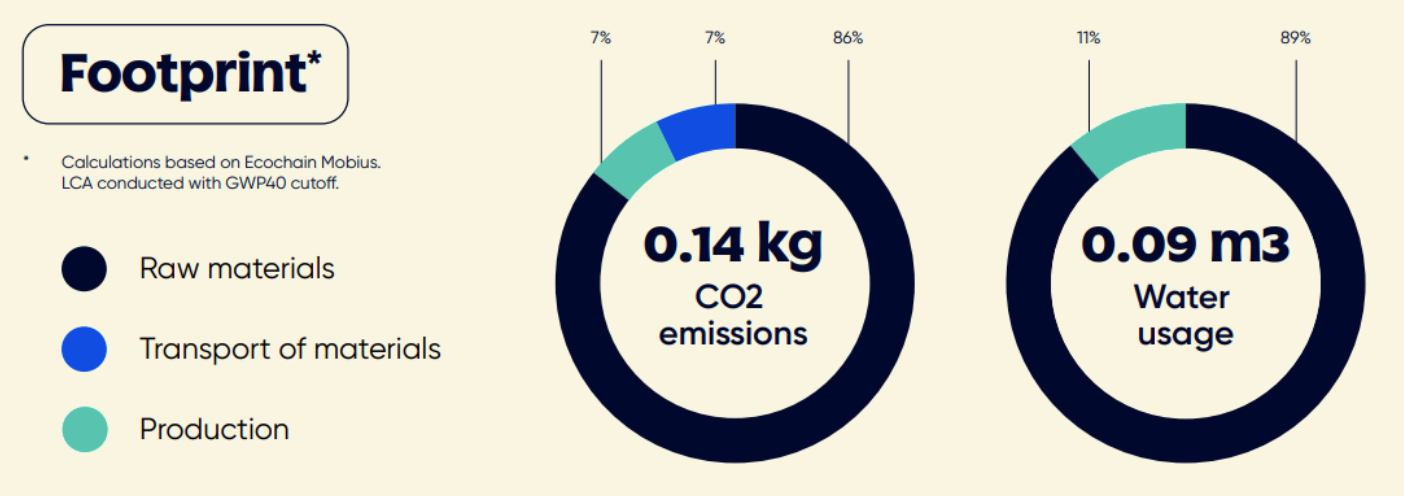
Turn complex concepts into diagrams
Since the LCA is full of complex concepts and advanced terminology, many readers will struggle to understand the information that is being presented to them. By turning complex concepts into diagrams, users are able to visualise the information instead.
Whether a flow chart, a pie chart, or a line graph best portrays the message a business is trying to make, breaking down data or information into image form will not only make the content more digestible, but will break up the web page nicely. The addition of colours, icons, arrows, and annotations allows viewers to take in the information without reading through large chunks of text.
Turning text into visuals means the flow of the website is bound to improve in an instant and people will be able to process more information in a shorter amount of time. This is ideal for getting key messages across and building up engagement on the page.
Creating Digital Stories With an LCA
LCAs should be more than a complex report tucked away in the bottom corner of a website – they are an opportunity for businesses to show off the sustainable nature of their products.
By using the key pieces of information in an LCA to create an engaging and informative user experience that educates visitors on the product’s lifecycle, a business can back up its sustainability claims to build trust among consumers.
As shown by Dopper’s digital product passport, LCAs offer a prime opportunity to show off a brand’s values and encourage shoppers to make more sustainable purchases.
This creative use of web design can transform a business’s digital strategy and give it an edge in a greenwashing landscape.