Summary (TL;DR) of what this article covers:
- Road infrastructure tenders across Europe increasingly ask for product‑specific carbon footprint or EPD data as part of award criteria. The revised Construction Products Regulation (CPR) phased in mandatory environmental declarations from January 2026, with full life cycle indicators targeted for all construction products by 2032.
- Asphalt’s cradle‑to‑gate carbon footprint is dominated by a few key processes, especially bitumen production and energy use at the mixing plant. In many LCAs, these two sources together account for roughly 70–85% of total A1–A3 emissions, depending on mix design and plant efficiency.
- With the right data foundation, asphalt producers can measure product footprints across an entire mix portfolio instead of commissioning one‑off studies. This can cut marginal EPD costs from several thousand euros per product in a traditional consultant model to a small fraction of that per mix when using LCA automation software like Ecochain.
- This article walks you through how asphalt emissions break down, the main measurement challenges, and a step-by-step approach to calculating and managing carbon footprints across your mix portfolio.
Why asphalt carbon footprint data matters now
Dutch Rijkswaterstaat uses the CO₂ Performance Ladder as an award criterion in a significant share of its infrastructure tenders. Contractors that commit to higher ambition levels on the Ladder receive a fictive discount on their tender price, which for Rijkswaterstaat commonly ranges from about 1% at Level 1 up to around 5% at Level 5, while some other contracting authorities apply higher percentages for the upper levels.
In Germany, public clients are increasingly adding CO₂ and broader sustainability criteria into infrastructure and building tenders, although the exact weighting and methodology still differ by authority and project. Some building projects, in particular, reference certification schemes such as DGNB and, in a smaller number of cases, BREEAM as part of their sustainability requirements.
This is not just a future requirement. Across Europe, a growing number of public infrastructure clients already use CO₂ performance or similar climate‑related criteria as live award factors in tenders, as seen for example in the way the CO₂ Performance Ladder is applied in Dutch infrastructure procurement.
The revised Construction Products Regulation (CPR 2024/3110) was published in the EU Official Journal in December 2024 and entered into force on 7 January 2025. Implementation follows a phased timeline:
-
8 January 2026: First application date. For product families whose harmonized standards have been updated, manufacturers must declare environmental performance for Annex II (a–d), including Global Warming Potential (GWP).
-
9 January 2030: Expanded application covering Annex II (e–m), adding further environmental and sustainability indicators.
- 9 January 2032: Full application of Annex II (a–s), with comprehensive life‑cycle environmental reporting foreseen across construction product families, as harmonized standards are revised and cited.
Continue reading: Construction Products Regulation (CPR) 2024–2032 guide: What manufacturers need to know
Asphalt mixes fall under the broader CPR product family for road construction products, but asphalt itself is not singled out among the very first priority product families for the technical acquis work. The timing of detailed obligations for bituminous mixtures will depend on when the EN 13108 series is revised and cited under the new CPR, so practical requirements for asphalt producers may only fully apply once those updated standards are in place, which could align with the later implementation milestones toward 2030–2032 rather than the very first wave.
However, evolving tender requirements and client climate targets are already creating demand for verified carbon data ahead of formal regulatory mandates. Producers that cannot document product‑level carbon footprints and related certifications may find themselves at a disadvantage where climate performance is scored, while those who can provide robust data often gain tangible scoring benefits in competition for public contracts.
This article outlines how asphalt emissions break down across life‑cycle modules, the operational challenges of measuring a full mix portfolio, and a practical workflow for embedding carbon footprint measurement into your production processes.
What asphalt carbon footprint measures
A carbon footprint quantifies the greenhouse gas emissions associated with producing a defined amount of asphalt, typically one metric ton of mixture, over a specified life‑cycle scope. It is calculated using Life Cycle Assessment (LCA) methodology in line with ISO 14040/14044 and reported according to EN 15804+A2 for construction products.
The declared unit for asphalt mixtures in most EPD programs is one metric ton of manufactured mix; in some cases, especially when looking at an entire pavement structure or including use‑stage performance, results may also be expressed per square meter of paved surface over a defined reference service life. In practice, many asphalt EPDs focus on cradle‑to‑gate system boundaries covering modules A1–A3 under EN 15804.
- A1 (Raw materials): Extraction and processing of bitumen, aggregates, and additives
- A2 (Transport): Movement of raw materials to the asphalt plant
- A3 (Manufacturing): Energy consumption for heating, mixing, and storage at the production facility
In addition to A1–A3, some EPD programs and project specifications also include A4 (transport to site) and A5 (installation), resulting in an A1–A5 “cradle‑to‑gate with options” scope. For asphalt mixtures, modules A1–A3 generally capture a large share of the emissions that the producer can directly influence, particularly those linked to binder and aggregate supply and plant energy use, while A4–A5 depend more on project‑specific logistics and laying practices.
Product Category Rules (PCRs) for asphalt mixtures are developed under EN 15804 and typically reference the EN 13108 series of product standards to define requirements specific to bituminous mixtures. This combination of EN 15804 and asphalt‑specific PCRs promotes consistent methodology across different producers and mix types, provided that the same PCR and system boundaries are applied.
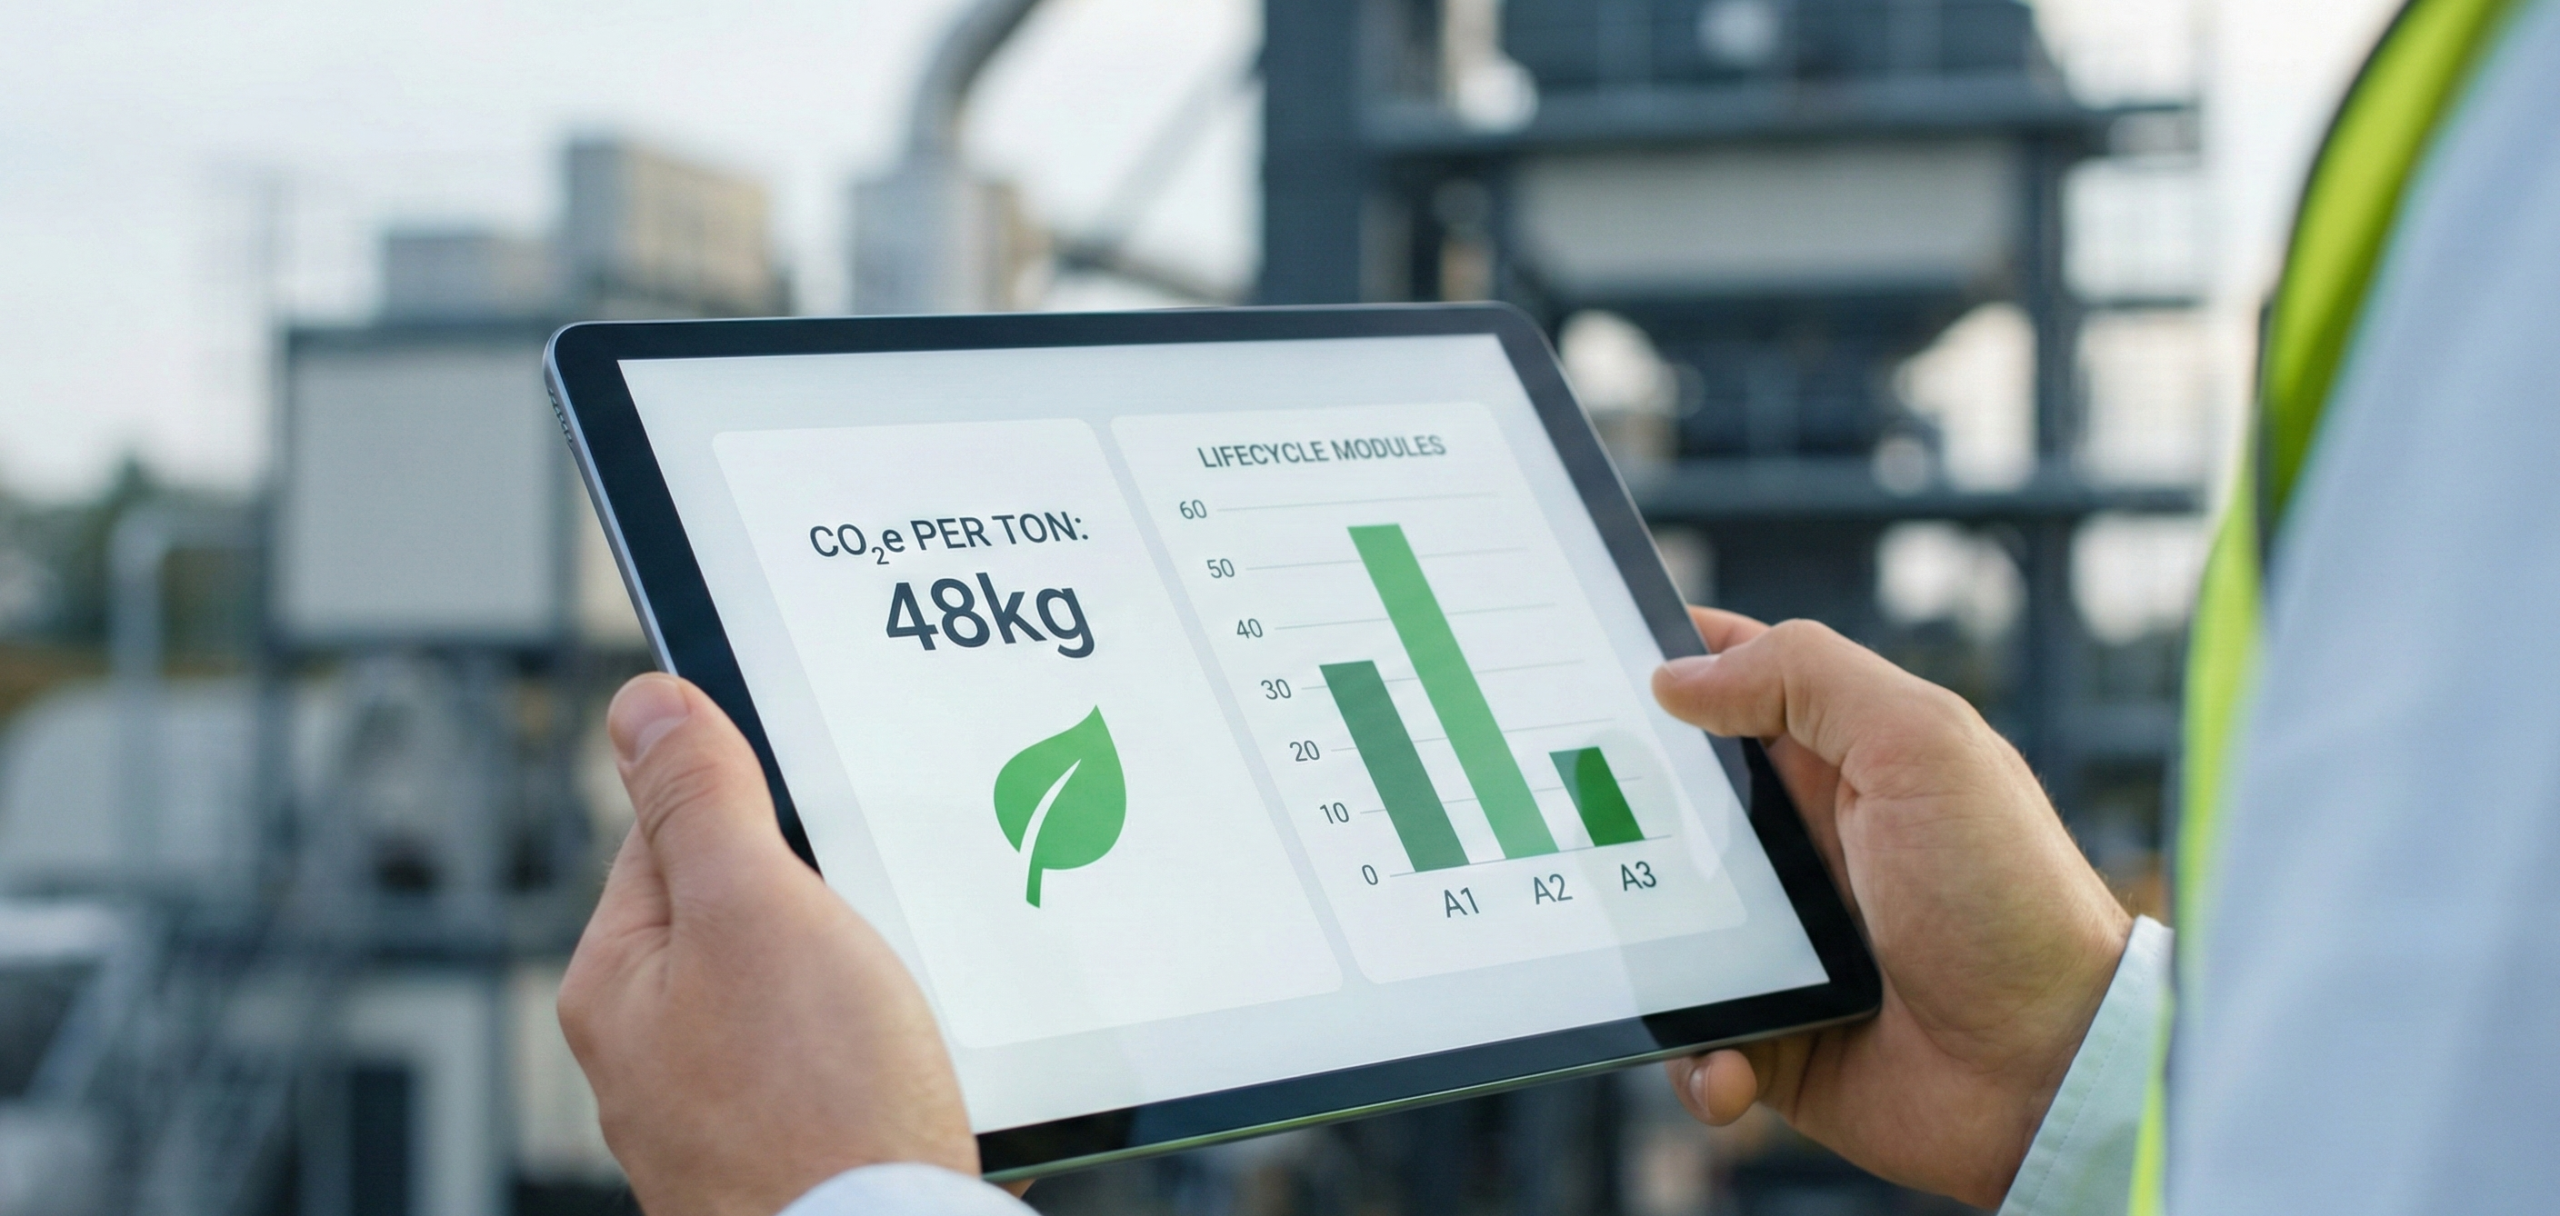
The result – typically expressed as kg CO₂e per metric ton of mix for the defined life‑cycle modules – can be used to compare asphalt products with equivalent performance and aligned system boundaries, and to inform low‑carbon procurement decisions.
How asphalt emissions break down
Understanding where emissions originate helps identify reduction opportunities. For typical hot mix asphalt, the carbon footprint distributes across lifecycle modules as follows, depending on mix design and supply chain setup:
| Lifecycle Module | Typical Contribution | Key Variables | Data Sources |
| A1 – Raw materials | 45-60% | Bitumen grade, RAP content, aggregate type | Supplier EPDs, refinery data, quarry certificates |
| A2 – Transport | 5-15% | Distance from suppliers, transport mode | Logistics records, fuel consumption data |
| A3 – Manufacturing | 30-45% | Mix temperature, plant efficiency, fuel type | Energy meters, production logs |
Bitumen production (A1) typically represents the largest single contributor. Published European refinery data reports a GWP of roughly 500–620 kg CO₂e per ton of bitumen, depending on grade and allocation method. With typical binder contents of 4–6%, this corresponds to roughly 20–37 kg CO₂e per ton of finished asphalt from bitumen alone.
Reclaimed Asphalt Pavement (RAP) can significantly cut A1 emissions by displacing virgin binder and aggregates. Studies typically show mixes with 20–40% RAP achieving 15–30% lower cradle‑to‑gate GHG emissions compared to 0% RAP equivalents, with savings scaling based on RAP processing energy, allocation method (e.g., cut-off or substitution), and binder displacement efficiency. Higher RAP levels of 40–70%, often enabled by additives for performance, can push total reductions toward 30–40% in optimized cases.
Even though A2 usually contributes less than A1 or A3, long-haul distances or inefficient logistics can easily add 5–10 kg CO₂e per ton of mix, making supplier proximity and load optimization worthwhile.
Plant energy consumption (A3) varies widely by method. Warm mix asphalt (WMA) at 110–140°C typically requires 10–25% less fuel than conventional hot mix asphalt (HMA) at 150–180°C, thanks to lower temperatures and additives. Well-optimized WMA plants with moisture control and efficient burners can achieve 20–30% fuel savings, though this is the upper range of published results.
Aggregates and filler contribute smaller but still measurable impacts within A1, especially given the large tonnages involved. Local sourcing can substantially reduce A2 transport emissions, while using recycled aggregates can lower A1 impacts compared to exclusively virgin materials.
Challenges in measuring asphalt carbon footprint
The LCA methodology behind carbon footprints is well-established and standardized. But applying it across a full range of asphalt mixes can often hit real operational roadblocks.
-
Bitumen data gaps: Refineries rarely provide detailed upstream emissions for their specific binder grades (e.g., 50/70 penetration or polymer-modified). Sustainability teams often rely on generic database averages that may not match their supplier’s actual processes – supplier-specific data would be more precise but is tough to get.
-
RAP accounting complexity: How much emissions “credit” should reclaimed asphalt pavement (RAP) get for replacing virgin materials? EN 15804+A2 sets the allocation rules, but consistently applying them across varying RAP sources, qualities, and mix percentages takes careful – and time-consuming – methodology.
-
Plant energy allocation: Most asphalt plants track total energy use (like your monthly gas/electricity bills), but don’t have meters breaking it down by individual mix type. Splitting facility-wide consumption across 20+ recipes requires extra measurement systems or estimation rules.
-
Too many mix variations: A typical plant runs 15–30+ different recipes for roads, bike paths, parking lots, etc. Manually collecting data and running calculations for each – even using Excel templates – can take days or weeks per product.
-
Third-party verification: Tenders increasingly demand independently verified data (like EPD certification). Compiling the documentation and models for external review adds weeks of extra work per mix.
-
Cost doesn’t scale: A one-off consultant study for your flagship mix might cost €5,000–10,000 including data work, modeling, and verification prep. Across a full portfolio? The expense and time quickly become prohibitive.
How to measure the carbon footprint of your asphalt products
Follow this systematic process to build scalable carbon footprint measurement into your operations.
Step 1: Establish your data foundation
Identify key data sources for each lifecycle module: supplier EPDs or certificates for raw materials (A1), logistics records for transport distances (A2), and energy consumption records for plant operations (A3). Create standardized templates that map these data fields directly to LCA calculation requirements.
LCA automation software solutions like Ecochain help manufacturers organize and manage this data. This reduces manual data transfer and helps keep calculation inputs current with production changes.
Step 2: Define scope and boundaries
Confirm your target tenders’ requirements—A1-A3 (cradle-to-gate) is standard, though some request A1-A5 including site transport and installation. Document your declared unit (typically 1 metric ton of mix) and system boundaries upfront.
Step 3: Model your mix designs
Build digital models for each asphalt specification, capturing bitumen content and grade, RAP percentage, aggregate composition and sources, production temperature, and plant configuration. Link these parameters directly to your live data sources.
Step 4: Calculate and validate
Run EN 15804+A2-compliant calculations across your models. Benchmark results against public EPD databases like EPD International (environdec.com) or IBU (ibu-epd.com)—typical hot mix asphalt falls in the 40–75 kg CO₂e/ton range, so outliers warrant investigation.
Step 5: Prepare verification documentation
Generate verifier-ready outputs: calculation summaries, data provenance trails, assumption logs, and sensitivity analyses. Maintain version control showing how inputs evolve with production changes.
Manual workflows work for one product but collapse at portfolio scale. LCA automation software built for non-experts (e.g., Ecochain) handles steps 3–5 across dozens of mixes in hours, not weeks. Once your data infrastructure is mapped (Steps 1–2), new recipes become a point-and-click process. This scales to meet tender demands without traditional consulting processes, spreadsheets, or repeated manual validation.
Continue reading: Choosing the right EPD software for construction manufacturers: 7 key factors to consider
Best practices for asphalt carbon footprint management
Once your carbon footprint calculations are running smoothly, these proven practices help you maintain accuracy, efficiency, and compliance across your asphalt portfolio. They address common pitfalls that trip up even experienced teams.
- Create consistent product templates: Build standardized LCA models for your main mix families (AC dense asphalt concrete, SMA stone mastic asphalt, PA porous asphalt). This ensures calculation consistency and lets you assess new variations in minutes rather than rebuilding from scratch each time.
- Systematize supplier data collection: Request EPDs, PCF declarations, or upstream emissions data from bitumen and key aggregate suppliers annually. Store everything in a central repository so it’s instantly available for LCA updates and verification audits.
- Establish quality assurance ownership: Designate a data steward or LCA champion responsible for input accuracy, model review, and staying current on standards like EN 15804+A2. This person becomes your internal expert for tender discussions and verifier interactions.
- Document assumptions rigorously: When supplier-specific data isn’t available, clearly note which LCI database values (e.g., Ecoinvent) you applied and your rationale. Verifiers always check data quality assessments – this level of transparency is non-negotiable.
- Align regional requirements upfront: Map differences between target markets before finalizing your methodology. Dutch CO₂ Performance Ladder emphasizes verified emission reductions, while German DGNB projects may require broader life-cycle indicators. Know your audience to avoid rework.
These practices turn one-off compliance exercises into competitive advantages. Template-based workflows and systematized data make portfolio-wide EPD generation routine, positioning you ahead of regulatory timelines and tender scoring curves.
How Ecochain supports asphalt manufacturers with product footprinting
Managing carbon footprint data across dozens of mix designs requires more than spreadsheets. It requires infrastructure built for portfolio-level assessment.
Ecochain’s LCA automation software helps asphalt producers build this capability in-house. The software guides you through data collection, modeling, and verification preparation – all following EN 15804+A2 methodology.
The result: verified carbon footprint data across your product range at significantly lower per-product costs than consultant-led approaches. After initial platform setup and data foundation work, marginal costs for additional products drop substantially compared to €5,000-10,000 per consultant engagement.
Sustainability, product, and R&D teams become internal experts instead of coordinating external consultants. The capability stays in-house.
Connect with our team to see how Ecochain works for asphalt production workflows.
FAQs about carbon footprint for asphalt products
How long does it take to calculate asphalt carbon footprint?
The total time necessary to calculate the product carbon footprint for asphalt depends on whether you commission a one‑off study or build a repeatable LCA setup.
-
Consultant‑led, one‑off studies: For a single asphalt mix, data collection, modelling, reporting, and verification preparation typically take several weeks, and end‑to‑end EPD projects often run over multiple months depending on data availability and verifier scheduling.
-
Software‑supported with LCA automation: Once your LCA foundation is in place (plant configuration, data connections, and templates for common mix families), most manufacturers can generate publish‑ready EPDs for additional asphalt products in days rather than weeks.
-
First vs subsequent products: The first product (or first plant) requires the largest effort to set up data structures, mappings, and documentation; subsequent mixes then reuse this infrastructure, so incremental time per product drops sharply, especially when only inputs like RAP share, binder grade, or aggregate proportions change.
What data do I need to measure asphalt carbon footprint?
Core requirements include your asphalt mix designs (binder content, aggregate types, RAP share, and performance class), plant energy consumption by fuel and electricity, annual material throughput, and transport distances from key suppliers. Upstream emissions for bitumen, aggregates, and fuels are usually sourced from recognized LCI databases based on your specified materials and origins, while production temperature, plant configuration, and operating conditions determine how much energy and emissions are attributed to each ton of mix.
What is a typical carbon footprint for asphalt?
Based on recent asphalt LCAs and EPD data, standard dense‑graded hot mix asphalt typically falls in the range of about 40–75 kg CO₂e per metric ton for the cradle‑to‑gate product stage (A1–A3). Mixes that combine higher RAP contents with warm mix technologies and cleaner fuels tend toward the lower end of this range, while conventional hot mix produced with mainly virgin materials and more carbon‑intensive fuels trends toward the upper end. Public EPD databases and national asphalt EPD programmes are useful benchmarks to check where your specific mix designs sit within this range.