Summary (TL;DR) of what this post covers:
- This post walks you through a five-step framework for building a product footprint data foundation before starting any LCA, PCF, EPD or DPP project. The insights are pulled from a video episode of our Behind the Product Impact series: Before you start product footprinting: 5 steps to prepare your data foundation.
- Most product footprint projects run late for the same reason: data collection wasn’t structured before the project started. The fix isn’t working harder once you’re already mid-project – it’s building the right foundation before the clock starts.
- You don’t need perfect data to calculate a credible product footprint. You need defensible data – consistent, representative, temporally and geographically appropriate, with assumptions clearly documented. These four quality criteria are what separate data that holds up under scrutiny from data that gets questioned. Secondary data from databases like ecoinvent is widely accepted and works well when primary data isn’t available.
- The best practice for product footprint data foundation work is to build it with reusability in mind from day one. The BOM version you lock down, the stakeholder map you create, the quality rules you agree on – these should carry forward to every subsequent PCF, EPD or DPP project, so you’re never starting from zero again.
Why most product footprint projects stall before they start
Most sustainability managers don’t choose the timing of their first product carbon footprint project. It often chooses them, and it tends to arrive in one of a few ways:
- A customer wants a carbon number before they’ll sign the contract
- A competitor publishes an EPD and leadership wants to know why your company isn’t doing the same
- Your sales or marketing team needs product impact data for a tender response or a green claims campaign
- A regulatory deadline – CPR, CSRD, ESPR – shifts from the watch list to the action list
So you start pulling data together. Requests go out to colleagues. Some reply in days, others take weeks. The procurement team sends a file that’s missing many fields. Your ERP has three versions of the same bill of materials and you’re not sure which one to use. The project that was supposed to take one month is now in its third.
Sound familiar? What looks like a methodology problem is almost always a data foundation problem – and most sustainability managers only discover it once they’re already mid-project.
This guide walks through a five-step framework for building your data foundation before you start calculating. It’s built on what we’ve seen work across thousands of product footprinting projects over 15 years – and it’s the same framework covered in our video episode Before you start product footprinting: 5 steps to prepare your data foundation, if you prefer to watch it first.
Continue reading: How to avoid the 11 most common product footprint mistakes on LCA, PCF and EPD projects
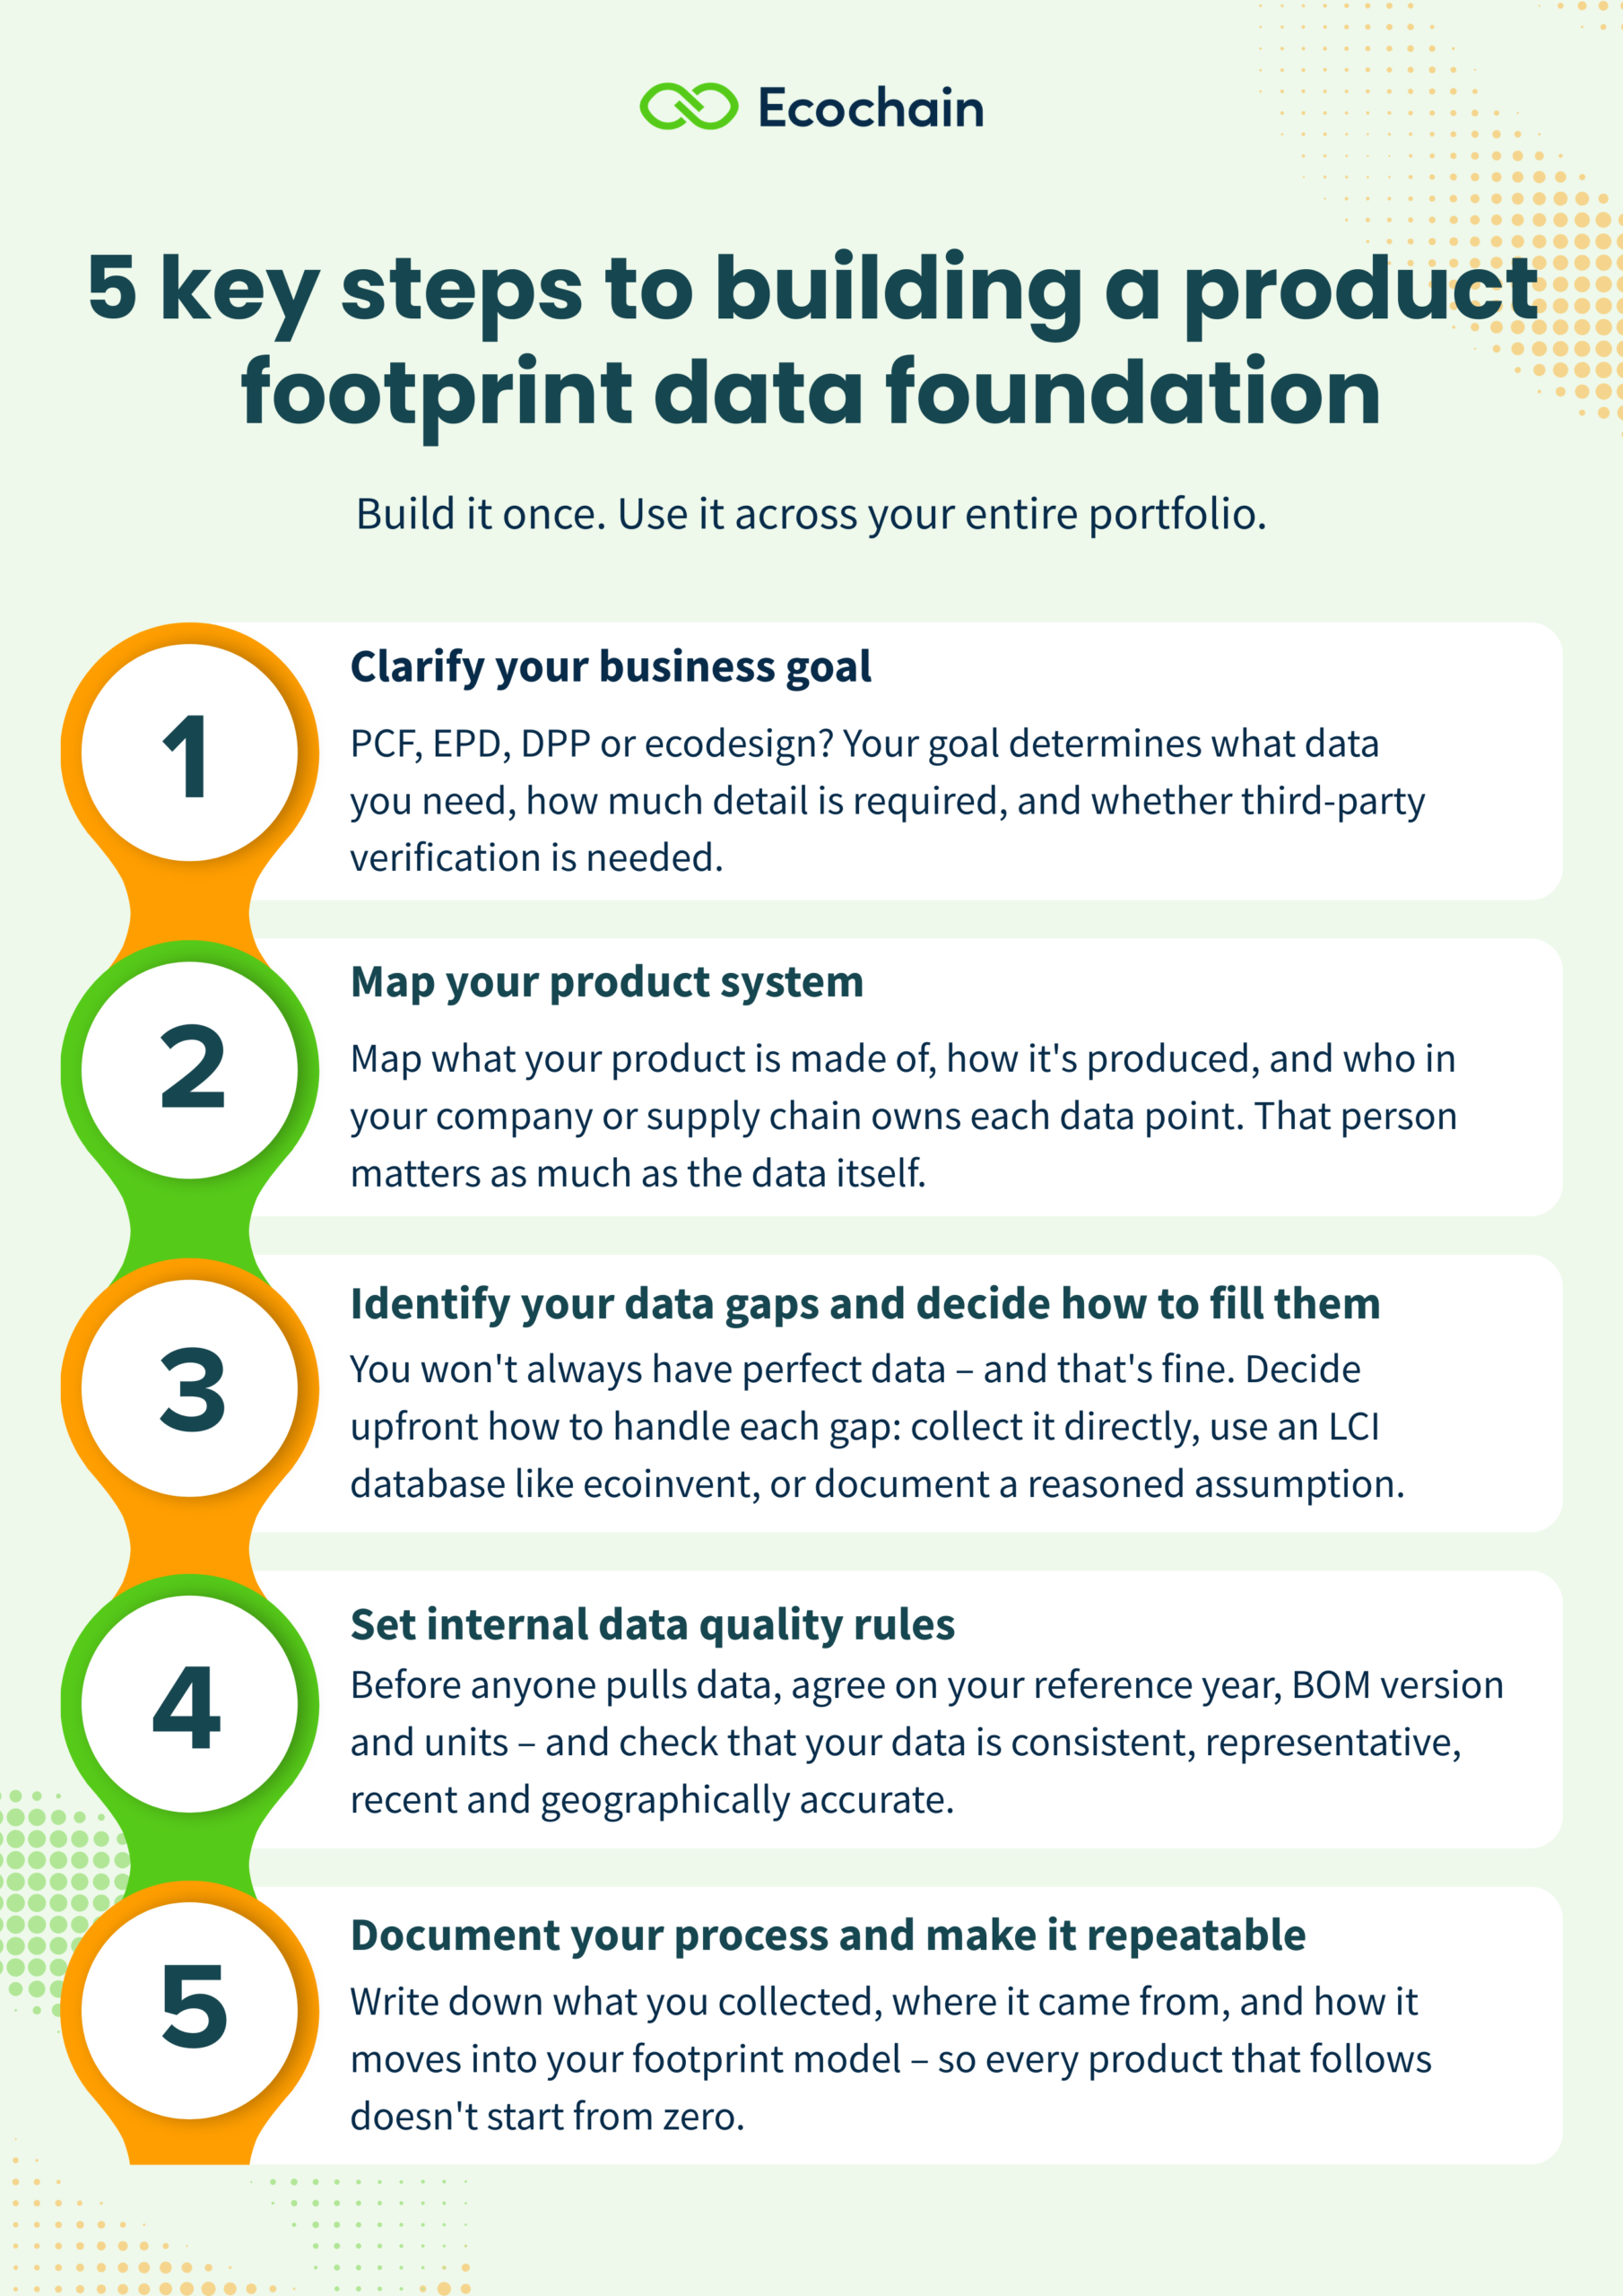
Product footprint data foundation – five-step framework
Scalable product footprint foundation
PCF · EPD · DPP · PEF – from product one to full portfolio, without starting from zero
Step 1: Clarify your business goal before you start collect product data for footprinting
Before you map a single process or send a single data request, get specific about why you’re doing this.
This sounds obvious. But the goal genuinely changes what data you need to collect – and how thoroughly you need to collect it.
A self-declared product carbon footprint for a customer who wants a rough carbon number needs different data priorities than a third-party verified EPD for a public tender. An internal ecodesign exercise needs different granularity than a CSRD-aligned report. Getting this wrong upfront can end up being expensive – not just in time, but in goodwill. Collecting minimal data for what turns out to be a verified EPD could easily mean going back to stakeholders a second time, with tighter deadlines and lower patience.
Pratik Gholkar, Sustainability Strategist at Ecochain, maps it out clearly: if your objective is to communicate a carbon number, a PCF analysis gets you there. If you want to improve the product, you’ll be doing ecodesign work – and you’ll need data broken down by material and process so you can model alternatives. If you’re going through a tendering process, you’ll need a full verified analysis where your data needs to meet verifier standards for quality and documentation.
Three different goals. Three different data priorities – for which you’ll need the same reusable data foundation.
What output do you actually need – PCF, EPD, PEF, DPP or a hotspot analysis for product improvement?Before you start collecting anything, work through these four questions:
That last question matters more than it usually gets credit for. If you’re planning to calculate ten or a hundred products eventually, building a scalable, reusable data setup from product one saves you an enormous amount of time later. As Pratik puts it: from the same LCA foundation, you can generate multiple product sustainability outputs as required by your business objectives. |
One more thing worth saying: there’s no shame in not knowing exactly which output fits your situation yet. This field is still maturing, and most sustainability managers are navigating it without a clear playbook. If you’re not sure where to start and how an LCA software could help you, reach out to us to see what’s possible for your needs.
| Learn more: EPD, PCF, DPP: How to know which LCA output you need for your next project |
Step 2: Map your product lifecycle system and identify your key data sources
Once you know what you’re calculating and why, the next step is to understand your product system – the full picture of inputs, processes and outputs that make up your product’s lifecycle.
Most manufacturing companies already have a process flowchart somewhere. In the engineering department, in a quality management document, in an older sustainability report. It doesn’t need to be perfect. Take what exists, trace through it, and ask: what’s missing? What level of detail do I actually need for this specific output?
Most of the picture already exists somewhere in your organization – the challenge is finding it, tracing through it, and identifying what’s missing.
2.1. How to prioritize your LCA data collection using the 95/5 rule
From your flowchart, start identifying the data points that matter most. The 95/5 rule is useful here as a directional guide: roughly 95% of your data should be high-quality primary data, covering the parts of your product system that drive most of the environmental impact. The remaining 5% can be filled with secondary data or reasonable assumptions.
Materials and production processes typically sit in the 95% bucket – they drive most of the impact in manufactured products. Transport, packaging and end-of-life usually contribute less, which means you can rely more on secondary data there without materially affecting your results.
One practical caveat: as Emma Thunnissen, Sustainability Expert at Ecochain, points out, you don’t always know what makes up the main impact until you’ve started calculating. So use the 95/5 rule as a directional guide early on, not a precise formula – and revisit it once your model starts taking shape.
2.2. How to map the stakeholders your footprinting project depends on
For every data point you’ve identified, write down who in your organization – or supply chain – owns it. That person is as important as the data itself. You’ll need their cooperation to collect it, their expertise to validate it, and their availability when something doesn’t add up.
Mapping stakeholders now means you can manage the process proactively rather than follow up with people reactively when a deadline appears. Internal stakeholders – operations, procurement, engineering – often have context that no spreadsheet captures. Ask them what common issues exist with this data, what outliers to expect, what tends to change year to year. That knowledge is part of your data quality picture from day one.
2.3. How to approach supplier data collection for any product lifecycle assessment
Your suppliers are external stakeholders too – and supply chain data is one of the biggest sources of gaps in any product footprint project.
Knowing upfront which materials come from which suppliers, and whether those suppliers can provide product-specific primary data or whether you’ll need to rely on Life Cycle Inventory (LCI) databases like ecoinvent, shapes how you plan the rest of your project.
A steel product whose supply chain originates in India or China, for example, will look very different in terms of data availability than one sourced locally – and that affects your modeling strategy before you’ve opened any LCA tool or calculator for product impact data.
For complex supply chains like these, it’s worth testing your data approach on one material or process before you commit to full calculation. This tends to surface hidden data issues while you still have time to address them.
Step 3: Identify your product data gaps early – and decide how you’ll fill them
With your product system mapped and your stakeholders identified, you’ll quickly see where the gaps are. Some data points will have clear owners and clean sources. Others will have neither.
This is the step where many sustainability managers feel the urge to pause – to wait until they have perfect data before proceeding. That instinct is understandable, and it’s also one of the most common causes of project delays.
As Pratik says: “Do not wait for the perfect data. Continuous improvement is way better than delayed progress.”
Why? Perfect data realistically doesn’t exist in LCA. What you’re aiming for is defensible data – data that’s fit for the purpose you defined in Step 1, documented clearly enough to survive scrutiny, and honest about where assumptions were made.
Your three options for filling product data gaps you need for LCA modelling
- Collect primary data – Go directly to the source – your procurement team, operations, engineering department, or your supplier. Primary data is always preferred because it reflects your actual product and production context. But in practice, it isn’t always available.
- Use secondary data – LCI databases like ecoinvent contain representative averages for thousands of materials, processes and transport scenarios. As Emma notes, you can achieve perfectly good, high-quality results with secondary data – and every LCA software provider relies on these databases heavily. Verifiers accept them. They’re part of how LCA works.
- Document an assumption – For low-impact data points where neither primary nor secondary data is practical, a reasoned assumption with clear documentation is acceptable. The key word is documented. An assumption you can explain and defend is not a weakness in your model. An assumption you can’t account for is.
Identifying gaps now, at the mapping stage, gives you options. You can decide in advance which gaps to fill with primary data, which to cover with secondary data, and which to handle with a documented assumption – rather than making those calls under deadline pressure.
Step 4: Set internal LCA data quality criteria your team can follow
Knowing how you’ll fill gaps is one thing. Knowing what counts as good enough is another – and that’s a question most teams don’t answer until a verifier asks it for them.
This is the step that tends to get skipped, and the one that tends to create challenges when you plan to use your product sustainability claims publicly or go through verification.
Getting clear on these four data quality criteria (consistency, representativeness, temporal and geographical coverage) before collection starts means you can brief your internal stakeholders properly from day one – they’ll know what you need and why, which makes the data you get back more useful from the start.
- Consistency: Is the data consistent across sources and time periods, or were figures pulled from different reference years?
- Representativeness: Is data representative of your actual product and production context, or based on a generic average that doesn’t reflect your situation?
- Temporal coverage: Does it reflect recent production, or are you working from data that’s several years old?
- Geographical coverage: Is it geographically accurate – does it reflect where your materials are actually sourced and your product is actually made?
Verifiers can also ask about all of these. Getting clear on these criteria before you start collecting product data means you can brief your internal stakeholders properly from day one. They’ll know what you need and why – which makes the data you get back more useful from the start.
4.1. Four internal data quality rules that prevent delays at verification
Beyond the four criteria, these practical rules are worth agreeing on before data collection begins:
- Agree on the reference year – Are you measuring this year’s production data or last year’s? The answer matters less than the consistency. Make sure everyone pulling data is working from the same time period – mixed reference years are one of the most common sources of inconsistency in product footprint projects.
- Resolve your BOM versioning issue before you start modelling – ERP systems often contain multiple versions of the same bill of materials – some current, some obsolete, some sitting in between. As Emma points out, if you pull the wrong version, your model is incorrect from the start – and you may not discover it until a verifier flags it. Agree with your engineering or operations team which version is authoritative, document it, and verify it before you build anything.
- Align on units across all data sources – Data that comes in from different teams often uses different units for the same material. Catching those inconsistencies during collection is much faster than untangling them after you’ve already started modeling.
- Involve the people who work with this data every day – Your operations, procurement and engineering colleagues know things about your data that no quality framework captures – common issues, expected outliers, what tends to change year to year. That context belongs in your quality rules, not discovered later when something doesn’t add up.
Why data quality issues are the most common reason EPDs and PCFs get rejectedA verifier’s job is to check that your model reflects reality. If your data has quality issues – wrong reference year, outdated BOM, inconsistent units, geographically mismatched secondary data – those issues most often surface at verification, not before. By that point, going back to stakeholders to re-collect data under deadline pressure is a very different conversation than the one you had at the start of the project. Setting these rules early doesn’t add work. It redistributes it – from the worst possible moment to the most manageable one. |
Step 5: Document your data collection process and turn it into a repeatable system with the right LCA software
You’ve identified what data you need. You know who has it. You’ve mapped the gaps and agreed on quality rules. Now do one more thing before you start calculating: write it all down.
Not as a formality – as a system. Without documentation, everything you’ve built in steps one through four lives in someone’s head, and the next time you need to calculate another product, you’ll be starting from scratch. This final step is what turns a one-off LCA project into a process your team can repeat, hand off, and build on.
5.1. How to document your LCA data collection process as a scalable playbook
Start by summarizing everything from the previous steps into a single clear plan: what gets collected, from where, by whom, in what format, and on what timeline. Specific enough that someone unfamiliar with the project could pick it up and know exactly what to do next.
Then go one layer deeper. For each data source, document how the data physically moves from that system into your footprint model:
- Is there an API connection?
- Can you export directly from your ERP?
- Does the export produce a CSV, a PDF, or something else?
- Does someone need to manually re-enter it, or can it be imported directly?
As Emma puts it: knowing how to get data out of your systems and into your product footprint calculator is what makes this whole foundation reusable – not just for this project, but for every PCF, EPD, PEF, DPP and LCA project that follows.
When your next product project starts, your team won’t be starting from zero. They’ll work from the same BOM version rules, the same stakeholder contacts, the same quality criteria, and the same data flows. Your next product life cycle assessment takes a fraction of the time product one did. Product ten becomes almost routine.
5.2. Use your documented data flows to choose the right LCA software for your needs
This is where your documentation directly informs a significant decision – choosing the right software for calculating the impact of your products.
The LCA software you use needs to complement or improve the workflows you already have. Knowing upfront how your data comes out of your systems – whether that’s a CSV export, an Excel file, or an API – means you can evaluate whether a tool’s import functionality actually fits your situation before you commit to it. If you’re planning to scale across a product portfolio, you also need software built to handle that without growing your workload proportionally.
As Pratik frames it: the LCA software has to fit your internal systems and your scale ambitions. The clearer you are on your data flows, the easier that evaluation becomes.
Continue reading: Choosing the right EPD software for construction manufacturers: 7 key factors to consider
From one product footprint to a scalable portfolio – how Ecochain makes this data foundation possible
These five steps don’t make data collection easy. What they do is shift it from something that happens to your project into something you control.
The first LCA project is almost always the hardest. You’re mapping a product system you’ve never mapped for this purpose, working with stakeholders who don’t yet understand why you need what you need, and making judgment calls about data quality without a clear benchmark.
Manufacturers who prepare their data foundation before starting see fewer mid-project delays, fewer quality surprises at verification, and a much faster path to calculating product number two, three, and ten. The rules you agree on, the BOM version you lock down, the stakeholder contacts you document, the data flows you map – none of that disappears after your first project ends. It becomes the foundation every subsequent project builds on, across your product portfolio, facilities and markets.
If you’re about to start your next PCF, PEF, EPD, DPP or hotspot analysis and want to talk through what your data foundation should look like – and how Ecochain software helps you build it – our team is happy to chat →
And if you’d rather watch than read, this framework is also covered in our Behind the Product Impact episode: Before you start product footprinting: 5 steps to prepare your data foundation.
Frequently asked questions about setting up a product impact data foundation
How long does product carbon footprint data collection typically take?
The timeline for product carbon footprint data collection varies significantly depending on how prepared the company is and how complex the product is. For manufacturers with no prior data setup, the first collection round commonly takes four to eight weeks. With a proper data foundation in place, subsequent projects often take a fraction of that time – and LCA automation software like Ecochain can reduce that further still.
What is the 95/5 rule in LCA data collection?
The 95/5 rule in LCA data collection is a practical guideline: aim for high-quality primary data on the 95% of your product system that drives most of the environmental impact, and allow more flexibility – secondary data, reasonable assumptions – on the remaining 5%. Materials and production processes typically fall into the 95% bucket. Transport and packaging often fall into the 5%. The catch is that you don’t always know which is which until you’ve started modelling – so treat it as a directional guide early on, not a precise formula.
Can I start calculating the product impact before I have all my data in a perfect shape?
Yes, you can start calculating the product impact of what you manufacture before you have all product data in a perfect shape. Waiting for perfect data before starting your model is one of the most common causes of project delays. Start with what you have, document your gaps and assumptions, and refine the model as better data comes in. Continuous improvement is more valuable than delayed perfection.
How does my data setup affect which LCA software I should choose?
Your product footprint data setup significantly affects which LCA software you should choose. The LCA automation software needs to complement the systems you already have – specifically, how your data comes out of those systems. Knowing upfront whether your data exports as a CSV, Excel file or via API means you can evaluate whether a tool’s import functionality actually fits your situation before you commit to it. If you’re calculating across a large portfolio, you also want software built to handle that scale without requiring manual re-entry each time.
How do LCI databases like ecoinvent help fill supplier data gaps in LCA?
Life Cycle Inventory (LCI) databases like ecoinvent provide secondary (generic) datasets that can be used to fill supplier data gaps when primary data isn’t available. For example, if you’re sourcing steel from China or India and lack supplier-specific data, you can select representative datasets for the relevant production route (e.g., blast furnace or electric arc furnace) and geography. These datasets model typical processes using industry averages and measured data, rather than reflecting a specific supplier’s operations.
How do you prevent data gaps from derailing a PCF, EPD or DPP project mid-calculation?
Preventing data gaps from derailing your project comes down to identifying and planning for them before modeling begins – not discovering them when your verifier is already scheduled. For every gap you find, decide upfront whether to fill it with primary data, cover it with a secondary dataset from an LCI database like ecoinvent, or handle it with a documented assumption. Keep a data management log throughout – recording which datasets you used and why. That’s what makes verification faster and future recalculations easier.