Case studiesHow to measure the environmental impact of education: The case of the UvA & HvA
Case study
How to measure the environmental impact of education: The case of the UvA & HvA
Usually, you hear about organizations measuring the environmental impact of their products or value chains. But can you also measure the impact of providing education? Of course you can! And the University of Amsterdam & the Amsterdam University of Applied Sciences wanted to find out exactly where their impact came from.
Other
Updated on: January 31st, 2024
13 min reading time
With great power comes great responsibility
What do you do when you are in a powerful position where you can educate the future generation?
Education is essential for sustainable development. However, educational institutions can also take additional responsibility in other ways. After all, they are large organizations that create a concrete impact on the environment as well.
The UvA and HvA both already have a great track record in implementing sustainable operations to make their campuses greener and greener. To be able to effectively continue doing so, they wanted to re-measure (compared to their earlier measurements from 2014) their environmental footprint and see what they could improve.
As a public institution, we need to lead by example. We have set out several key sustainability targets that fit with our institutional profile as a university.
Rowan Boeters, Program Manager Sustainability at the UvA
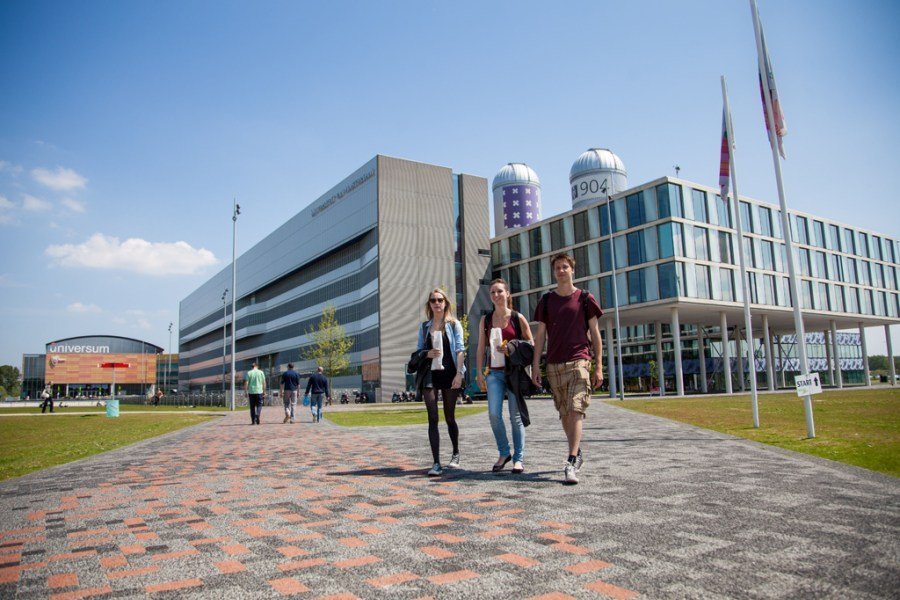
The campus of the University of Amsterdam. Source: iAmsterdam
First: how do you measure a service?
The UvA and HvA don’t produce usual products- they offer educational services. And that requires a slightly different approach when it comes to measuring environmental impact.
You see- when assessing an organization’s environmental footprint, you always look at their Scope 1, 2, and 3 emissions. These three scopes are categories of Greenhouse Gas Protocol (GHG) and are defined as follows:
Scope 1: Emissions from Scope 1 are direct emissions. This means that they directly come from your organization’s owned- or controlled source, such as; company vehicle emissions.
Scope 2: Emissions in scope 2 cover the indirect emissions from purchased sources, such as your organization’s consumed electricity or cooling. For example; emissions from burning fossil fuels at a power station that generates electricity.
Scope 3: Emissions from scope 3 include all the other indirect emissions within your entire value chain, this includes the upstream supply chain (suppliers), as well as downstream GHG emissions e.g. occurring with customers. Example; waste disposal transportation, or investments. This scope is often the most difficult to measure.
Because they don’t produce products, their direct emissions are quite low. Meaning that most of the UvA and HvA’s environmental impact lies in scope 3 (which is the same case for many service suppliers). How can you effectively map scope 3- and measure it?
Methodology
Ecochain’s tool Helix was used to conduct the LCA with Ecoinvent & Exiobase as the main environmental database. To assess the impact of these focus areas, a hybrid model (mixed method) of a Life Cycle Assessment (LCA) and the Input-Output model was applied. The LCA was conducted according to ISO norms.
The results in this case study are partially anonymized and summarized for illustration. If you want to learn more, please contact our research team.
Step 1. Finding the environmental hotspots
The UvA and HvA previously already assessed their scope 1 and scope 2 emissions but figured that most of their emissions occur in the notorious scope 3. They wanted to map out and measure their scope 3 emissions as an Education service provider. And create a final report to visualize the results.
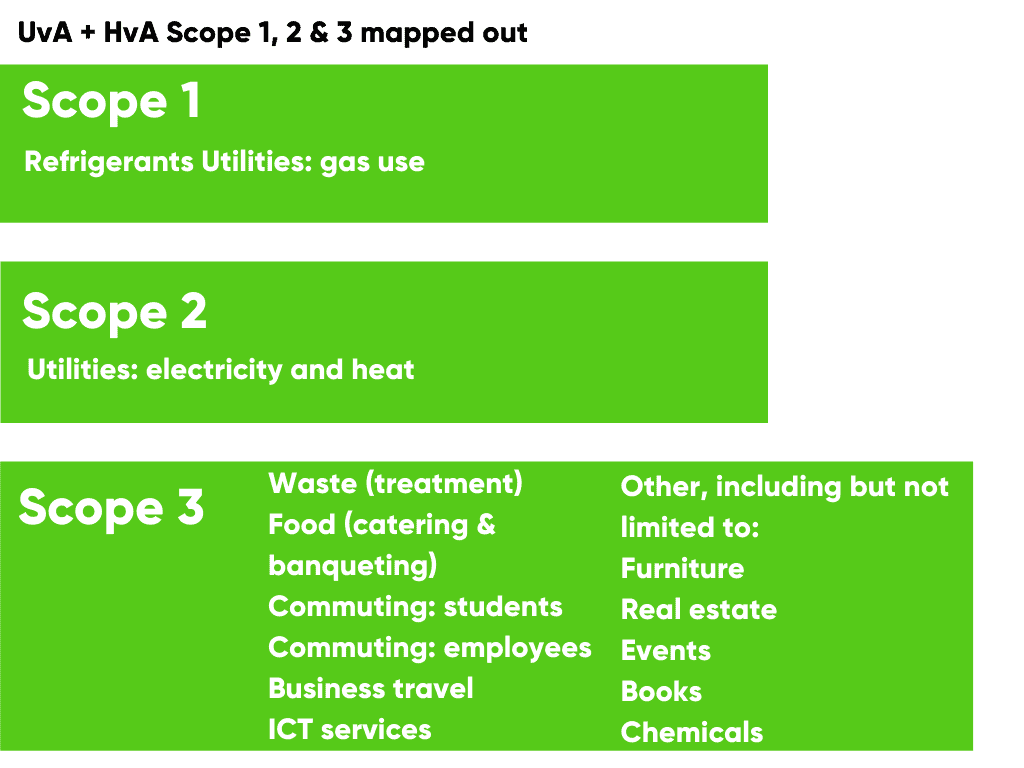
The project started with performing the main measurements for the scopes as outlined below (Image 1) and finding the potential hotspots of environmental impact. Here the aim was to find out what drives the UvA and HvA’s impact.
Image 1. Scope 1, 2 & 3 from UvA and HvA outlined.
The Results: Commuting students as the biggest impact driver
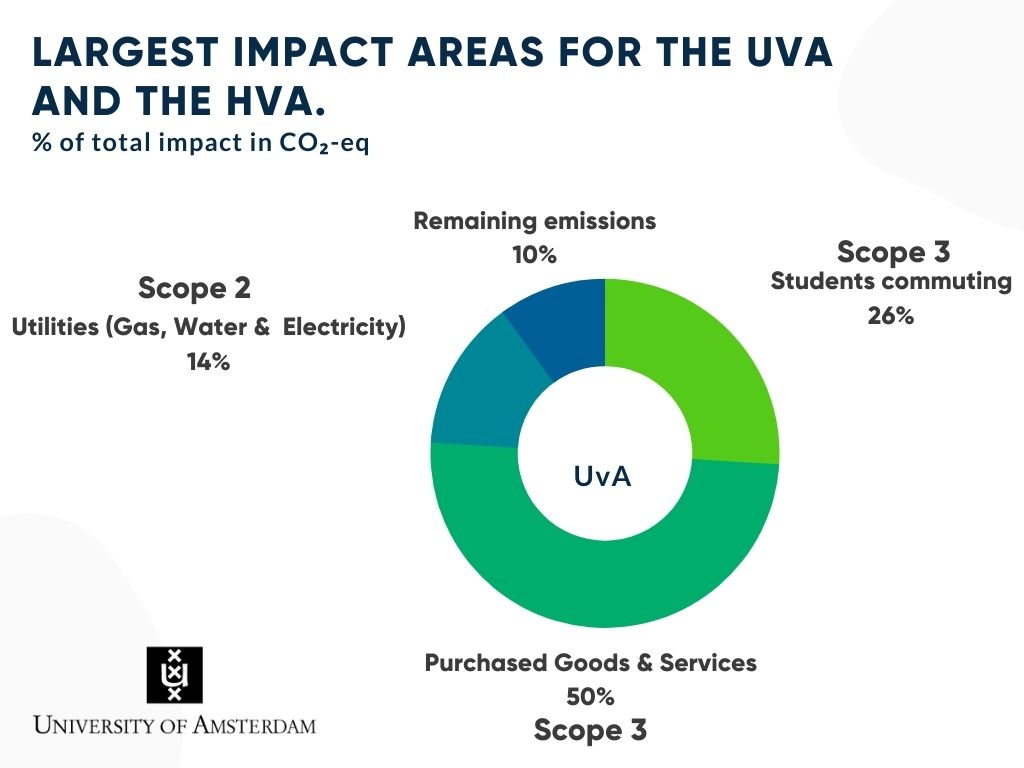
As expected with educational institutions- the results showed the biggest impact area for HvA, and the second biggest for UvA were: the students commuting (mainly by car) to their campus locations (image 2).
The second biggest impact area for both institutions was the area of ‘other purchased goods and services’ (image 2). This area accounts for the biggest impact at the UvA and the second-biggest for HvA. More in-depth information can be found in image 3.
The third biggest impact area came from their utilities- the use of gas, water, and electricity (image 2). The campuses need to keep running of course.
Image 2. Largest impact areas for the UvA and the HvA.Image 3: Other Goods & Services
Step 2. Finding potential impact reduction points
The second step in this project entails gathering environmental data. This provides operational insights into the potential impact reduction that can be achieved with the newly proposed sustainable initiatives. These initiatives take place in the following 6 key areas:
Real estate,
ICT, Food,
Waste,
Purchasing,
Mobility.
Measure 1: Reducing commuting students
Because the biggest impact area for HvA, and the second biggest for UvA were the students commuting to their campus locations. Reducing contact moments is a logical way to reduce impact.
By reducing contact moments one day a week, the UvA would reduce its impact by 7% and the HvA by 16%.
First, it seemed difficult to implement this measure, however, the COVID-19 crisis has shown that online education is possible. Of course, the COVID-19 crisis also brought this number back to zero real-life contact moments. Reducing the educational institutions’ impact significantly.
Measure 2: Reducing energy
Still, the UvA and HvA have large campuses that require energy to function.
Reducing their energy use to align it with the Paris Agreements and replacing the heat requirements from gas with heat pumps- would reduce UvA’s total emissions by 13% and HvA’s total emissions by 4%.
Remaining measures
The internally focused sustainability initiatives from the institutions, all have seemingly little effect on reducing the UvA’s and HvA’s overall environmental impact (<1%):
Refurbished 20% of ICT purchases (<0,5% impact reduction),
Extending the use of electronic devices by 9 months (<0,5%)
Removing bottled water from catering services (<0.01% impact reduction);
Vegan banqueting events and adjusting the composition of meat in catering to 50% chicken and 50% pork (<0,5%) (<0,5% impact reduction);
However, every initiative counts, and together these initiatives do add up to a more sustainable future. Moreover, they help create a proactive movement towards sustainable development among the staff and students within these two educational services. Which is just as important as reducing energy use.
The emotional sustainability initiatives should get the right amount of attention in comparison to the reduction potential of strategic programs. This balance can easily be lost when the institution reacts to emotion.
Rowan Boeters, Program Manager Sustainability at the UvA
Campus with students – Amsterdam University of Applied Sciences. Source: HvA
Challenges to overcome – measurement model
This process of mapping out and calculating your environmental impact isn’t always easy. This is why Rowan Boetes from the UvA has some tips for other service organizations that aim to measure their footprint:
Store all your data centrally.
Put together an internal process to start your measurement process. Look for available data sources within your organization that are linked to these important impact points within your organization. Use software that can help you calculate your environmental impact.
Finally; put together concrete measures and measure if they work by already implementing them beforehand. This is how you learn what works and what doesn’t.
Data-driven sustainability is smart sustainability.
Moving forward: sustainable clarity & focus
So now we have all this information- what do you do with it? You share it- and inspire future action.
With the results and their initiatives in mind- UvA and HvA are now able to communicate- both internally and externally, what the impact reduction potential of their proposed sustainability initiatives is.
We are still investigating the communicational value or the results. This is not easy as it is quite a difficult message to convey.
Rowan Boeters, Program Manager Sustainability at the UvA
Why are these initial numbers so important?
First of all, the outcomes of this study helped create clarity on the possible effects of the UvA’s and HvA’s proposed impact reduction measurements. They set the stage for where you are in your sustainability journey and what you need to move forward.
Secondly, they also help to provide extra focus to, perhaps surprising, business areas where the implementation of sustainability criteria could truly work and lead to a drastic reduction of environmental impacts.
UvA and HvA have already undertaken considerable sustainable action- and by continuously measuring their environmental data they will continue to find more and more opportunities for reducing it every year.
Sign up for our newsletter:
Stories of sustainable change-makers and practical insights
on how to reduce your environmental footprint.